Device Summary
Key device metrics at a glance
This view presents all devices in tabulated form with key device metrics and indicators to give you an idea of their current status.
The [Device Summary] view is the default workgroup view you will see when you open the Ardexa web app, except where your workgroup administrator has set an alternate default view.
Data for this view is sourced from the:
Cloud: 5 min point-in-time refresh duration -
memory,disk,tempCloud: 15 min average, sampled x2/minute:
CPUDevice: 30 min refresh duration -
last reported data
The table lists can be filtered using the filters input provided on the LHS. Simply click on the filter icon to switch between include and exclude
Devices Named "z_ your DeviceName"
Any device with a name starting with z_* is automatically filtered out from status lists.
If you have existing devices that start with a z/Z then these will not be automatically filtered out of display list. The "_" being the important flag to distinguish between unused devices and devices that may legitimately start with the char z.
Sorting Columns
Click on any column to sort on its values. Click again to reverse that sort.
Defining Status & Thresholds
The status colour of your device's title and metrics are triggered when certain threshold conditions are met.
a red highlight tag is alerting to a danger condition
a yellow highlight tag is alerting to a warning condition, or, where no data is available to determine the state.
Thresholds of each Metric Status
The metric thresholds for each of the table columns are as follows:
| Metric | no alert | warning | danger |
|---|---|---|---|
Name device title | no conditions triggered | any of the device's metrics has status | device offline or any device's metrics has status |
Status seen by cloud just now-ish. NB. mouse-over info values are only available to users with read audit access | device online | n/a | device offline |
Days UpTime * running time since last machine startup | running | n/a | n/a |
Last Reported Data when any data last reported to the cloud | < 180 minutes | > 180 minutes < 1440 minutes | > 1440 minutes |
Missing Data * when any source data is missing from that device | < 2 days | > 2 days < 5 days | > 5 days |
Clock Accuracy absolute time difference between device's time and cloud's time | <= 1 minute | > 1 minute < 10 minutes | > 10 minutes |
Timezone device's meta timezone | n/a | n/a | n/a |
Avg CPU Used % over 15 mins ~ 30 samples | < 60 | > 60 < 80 | > 80 |
CPU Temp °C + last value reported since day start | < 80 | > 80 < 105 | > 105 |
Memory Used %+ last value reported since day start | < 70 | > 70 < 80 | > 80 |
Disk Used %+ last value reported since day start | < 70 | > 70 < 80 | > 80 |
OS Version updated by running bulk actions sync | > 10 Cloud device | >= 9 and < 10 | No OS (unknown) Ardexa Linux v+ No Ardexa Linux Update OS (button) |
Detect OS (button)
If a cloud device is online, clicking this will populate the OS version data similar to Device -> Manual Config -> Update Cloud
Caveat: Control Device access
* This value is reported directly by the device itself (not via ongoing cloud heatbeat). Hence if the device has a Status offline (i.e. not visible to the cloud), then no value can be retrieved.
+ This value is derived from ongoing cloud heartbeat blackbox data. The value sought will be the last value reported to the cloud for the current day.
The blackbox sampling rate is taken at 5 minute intervals. The sampling interval may coincide with elevated activity on the device going-on at the very same moment. This may result in higher than expected values.
BlackBox Plugin - The Device's Heartbeat Metrics
Many of these metrics are derived from the device's blackbox plugin. Hence, the latest version of this plugin needs to be installed on the device for all heartbeat metrics to be produced.
If a device is offline, an attempt is made to retrieve last reported metrics, for any time, for that device if they exist in the cloud store.
Downloading CSV data
Device Summary supports a CSV download of all of the relevant data in the page. This button can be clicked on the top - right of the page, beside the Disable summary toggle.
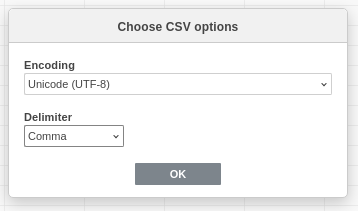
Upon opening the file, make sure to set the Delimiter according to the file format. Since the CSV is comma separated values, delimeter should be set as "Comma". If your workgroup has a specific delimeter set, kindly select the file's delimiter accordingly.
This file includes all columns and rows being displayed in the Device Summary Table excluding the icons and status colors. However, there are 2 additional columns that will also be included in the CSV. These are the Device Type and Blackbox.
In addition, the Last Reported Data column will have the cloud data timestamp instead of the time difference from the data recorded.
Last updated