Device Logs
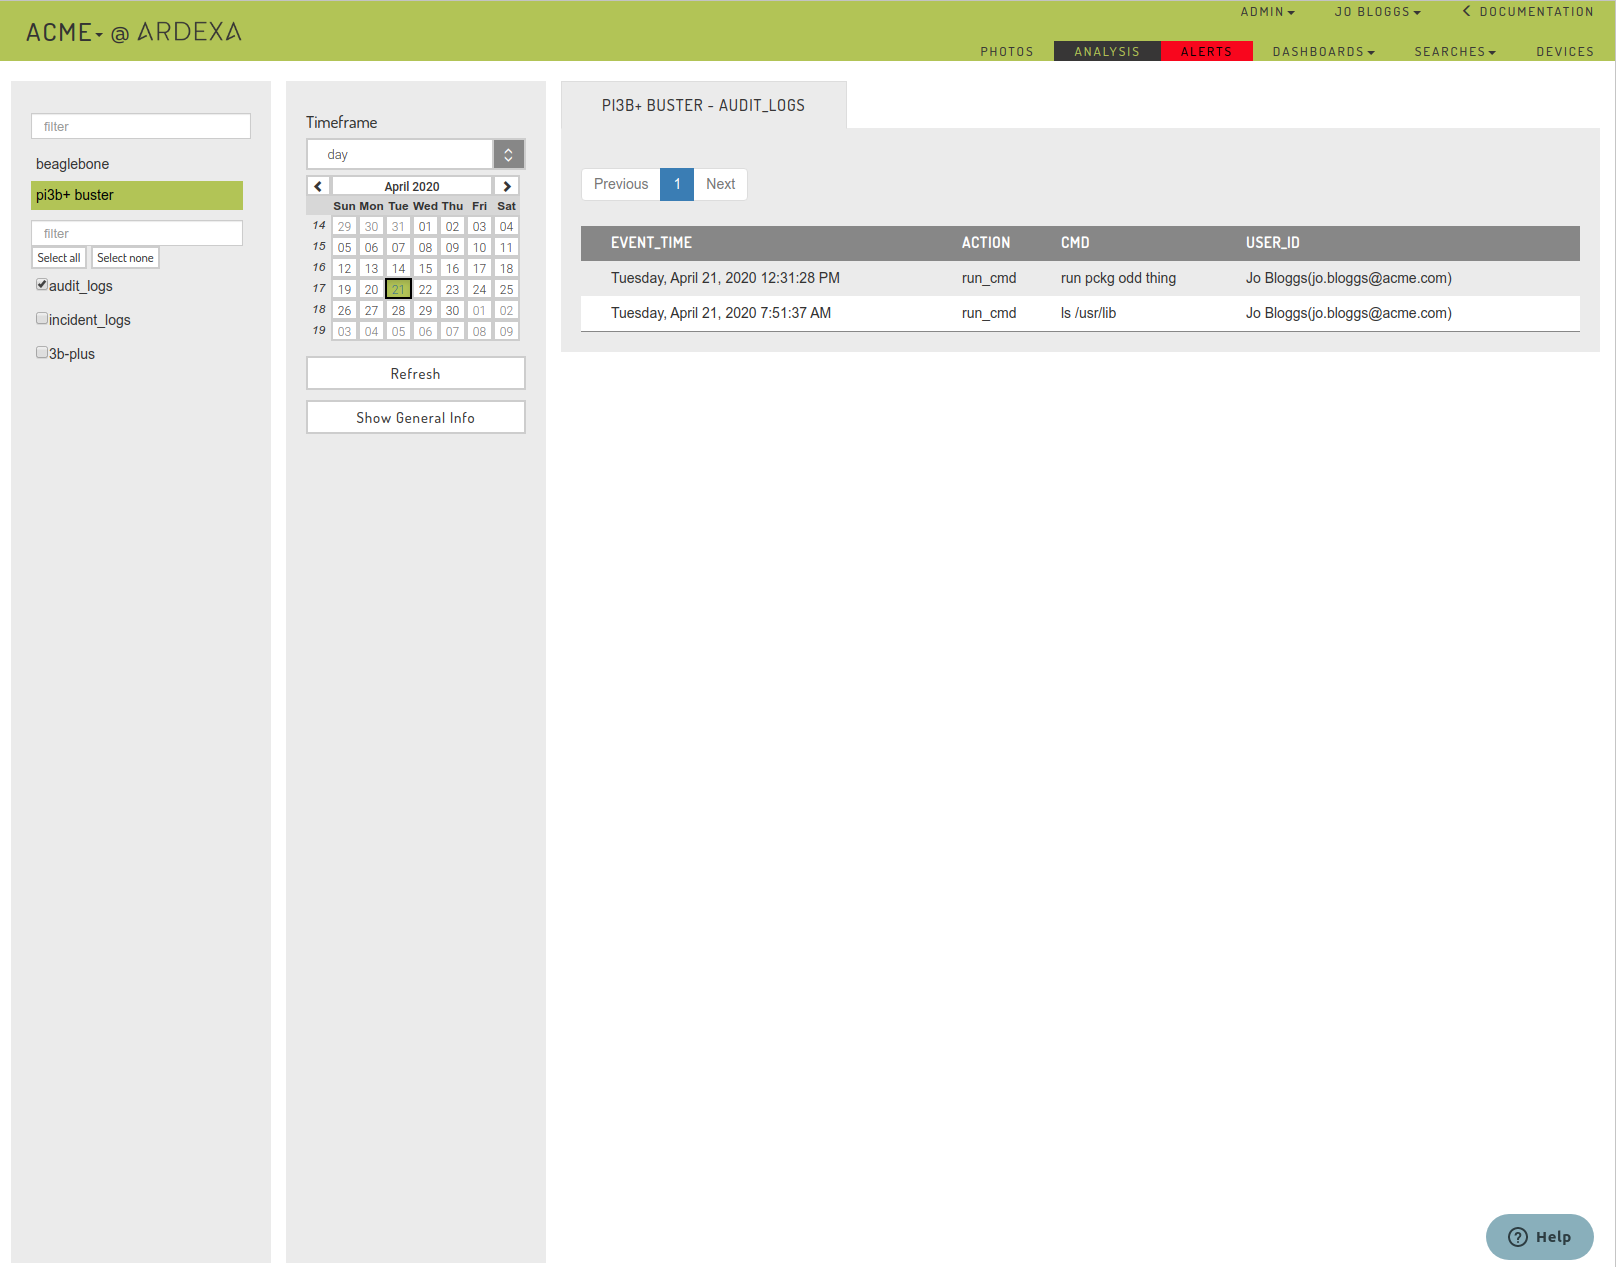
View audit logs and incidents related to the device
Your device'saudit_logs and incident_logs are typically discovered through the [SEARCHES] view tab as described here.
However, for your convenience, a summary of each device's audit_logs and incident_logsrelated to that device are provided to you as a device source within the analysis view.
To access the summary logs for a given device, simply select the device in the analysis view. You will see above the normal list of sources related to that device the table names:
audit_logsincident_logs
Selecting these tables as a source will generate a query for the related records for the currently selected device. Results are displayed in the view to the right-hand side.
Timeframe
Just as you apply a Timeframe to your analysis charts, you can also apply timeframes to your audit_log and incident_log as source-searches.
Things to Note:
audit_logscan only be generated if you have the appropriate permissions.As a summary, a reduced selection of table fields are displayed in the report.
As a summary, the report will only display the 50 most recent record entries.
Audit and Incident log reports cannot be run at the same time.
Audit and Incident log reports cannot be run with charts at the same time.
I need to see more detail
For a comprehensive report on the activities in audit_logs and incident_logs head over to the [SEARCHES] tab to build your own detailed search.
Hint: Logs from the Analysis view only provide a summary of fields for the device in context.
How can I use the summary device logs?
Let's say you find some irregularities in your analysis chart. In this scenario you can utilise the summary search reports provided to you without navigating away from your device's context. You are even able to apply the same Timeframe for the period under analysis.
These log reports will give you some insight as to what event may have caused the data irregularity you are seeing in the analysis chart.
Example
Last updated

