Alerts
Near Real Time Alerting is available in the Ardexa cloud.
Menu -> Alerts
Near Real Time Alerting is available in the Ardexa cloud. It allows email notifications when you need to be notified about significant events or conditions from your sources and machines:
Device Offline: when an agent has continuously been offline for some time
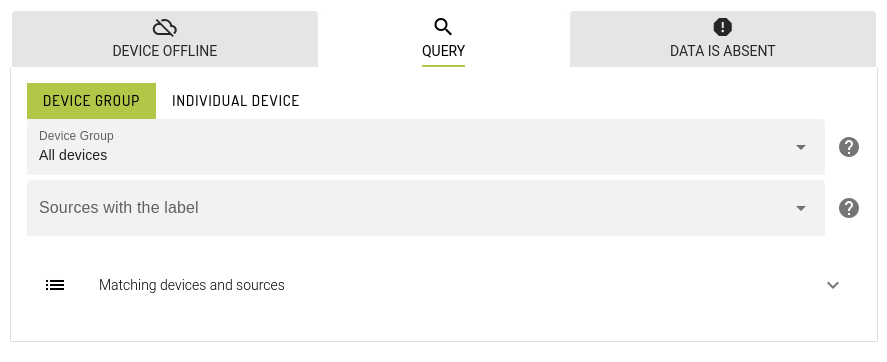
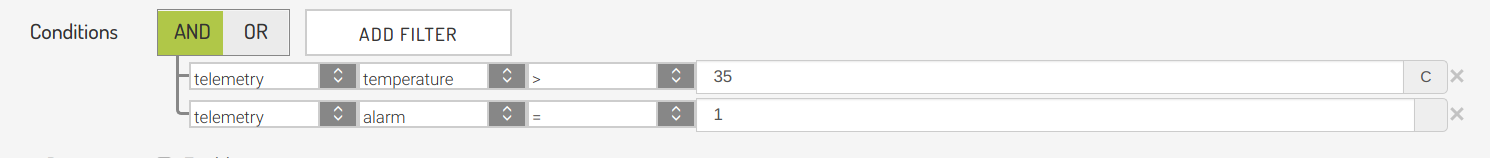
Query: when a set of conditions evaluates to true over a period of time
Data is Absent: when a data stream has stopped reporting, even though the agent is online
About Alerts
Alert records allow you to create conditional tests that will raise an Incident record when the condition is met.
About Incidents
When a predefined condition is met from your parent Alert a trigger will create an Incident entry.
You can be notified when an incident is raised.
You can view all Incidents ever raised by a particular Alert
You can view
Activeincidents and acknowledge them.You can chart your incidents to visualise your running environment.
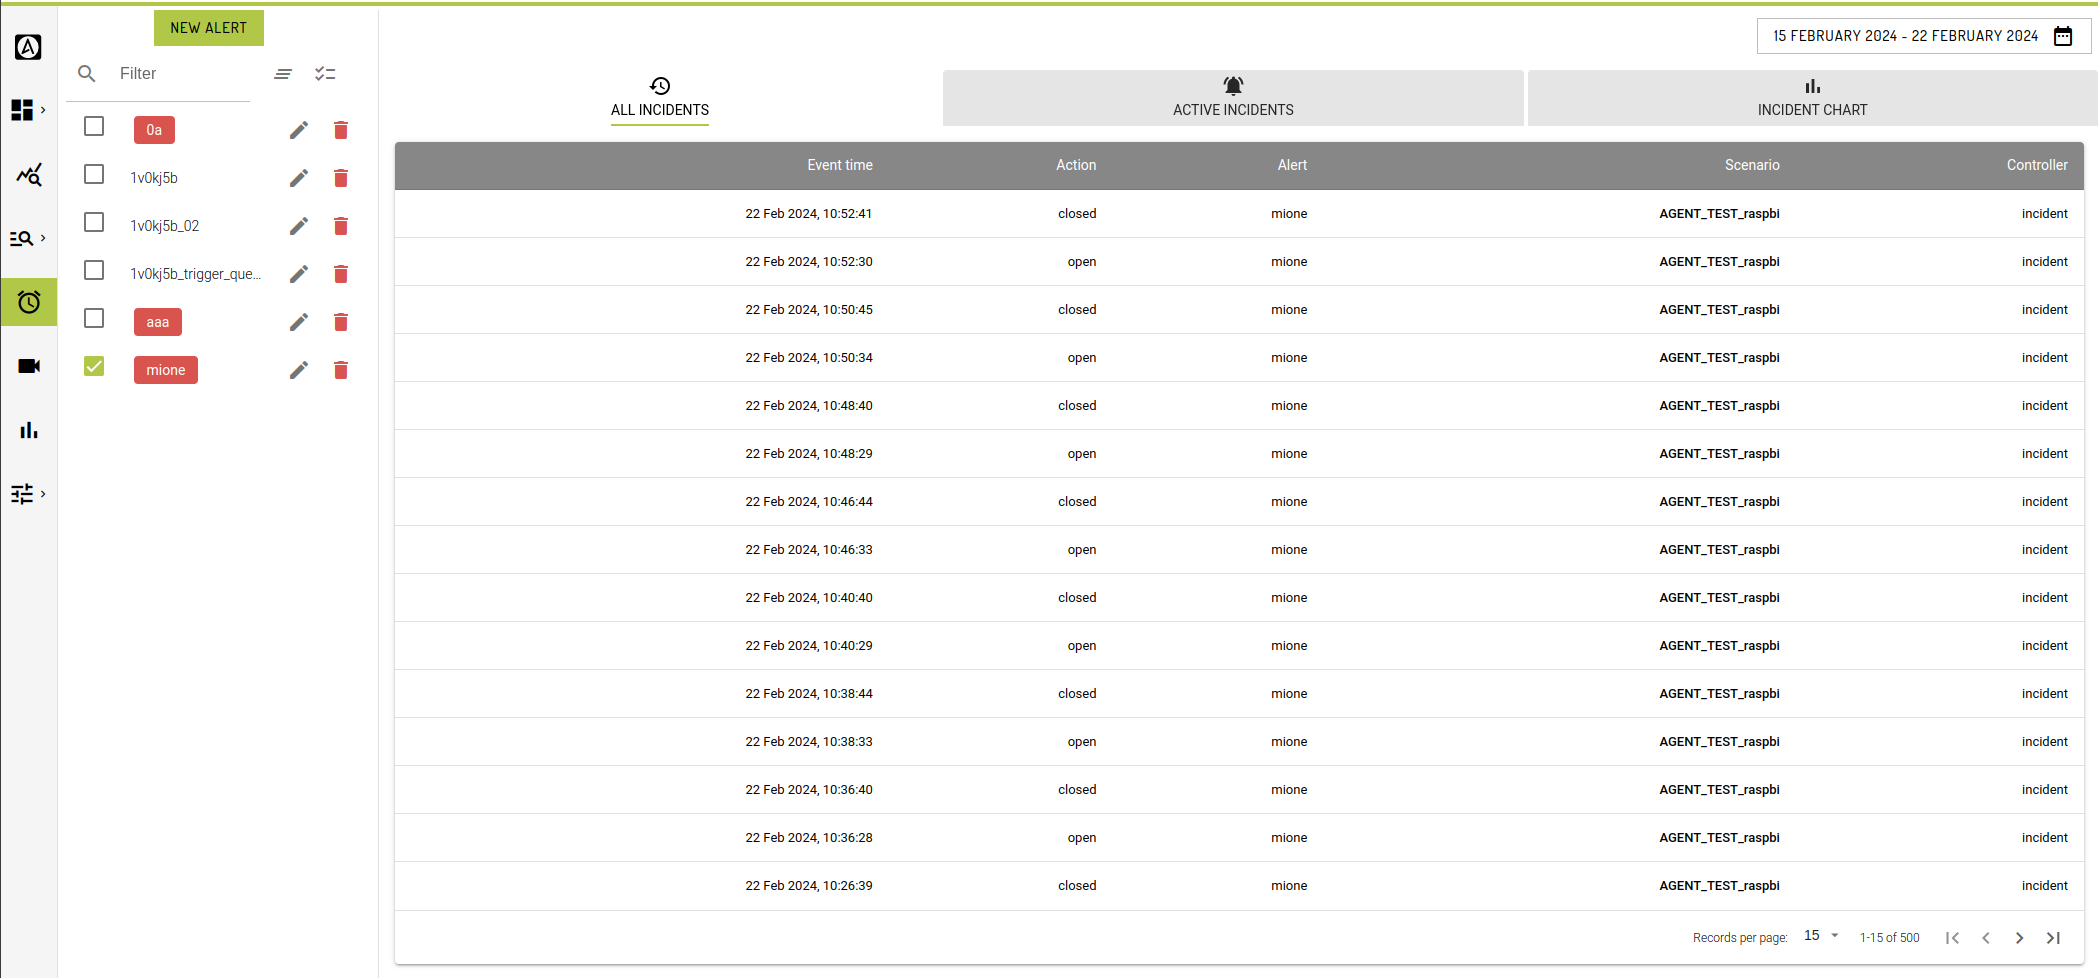
Tab: All Incidents
The default landing tab of the Alerts view is the ALL INCIDENTS tab. This view allows you to select predefined alerts in your current workgroup and retrieve all historical incidents associated to the selected alert. This is similar to running a search from the SEARCHES view over the incidents_log table.
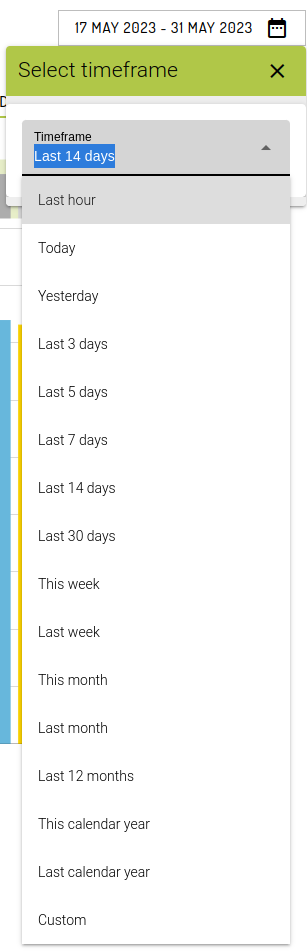
You can apply a predfined [Timeframe] or select your own custom timeframe from the timeframe picker.
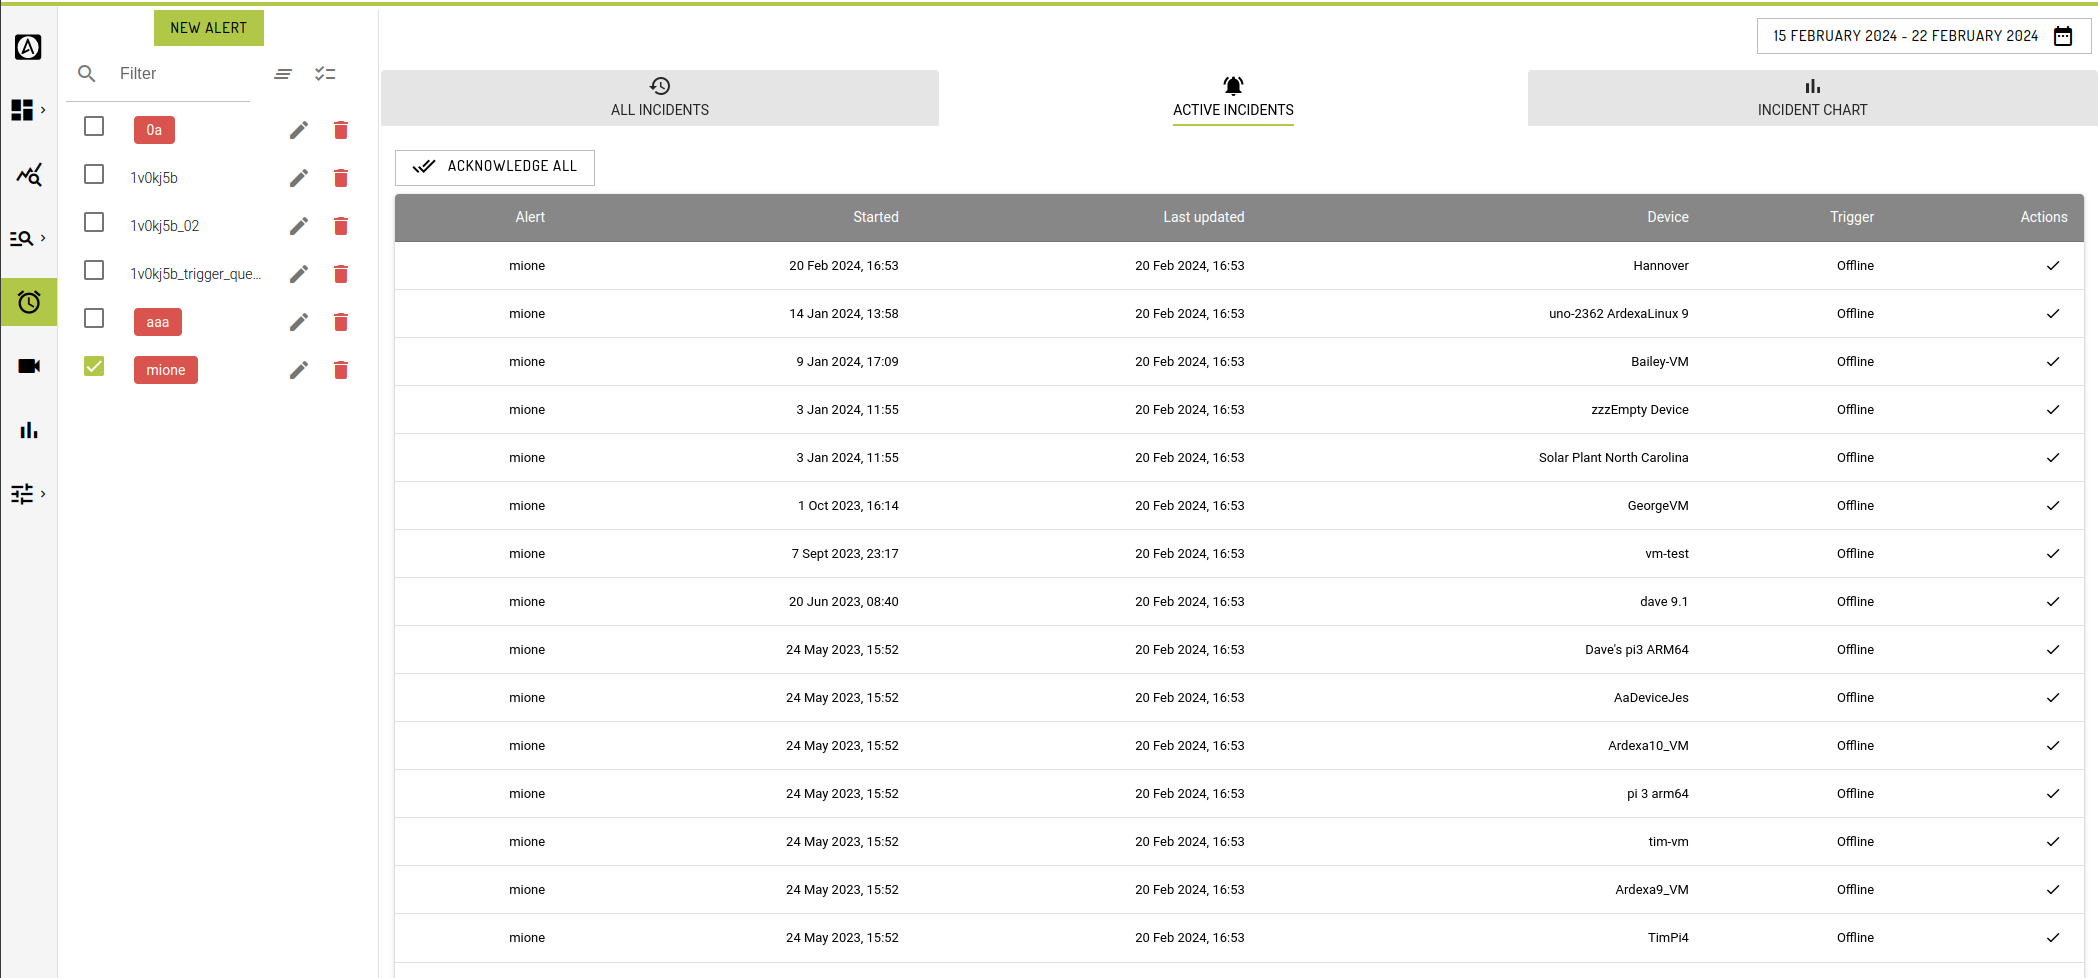
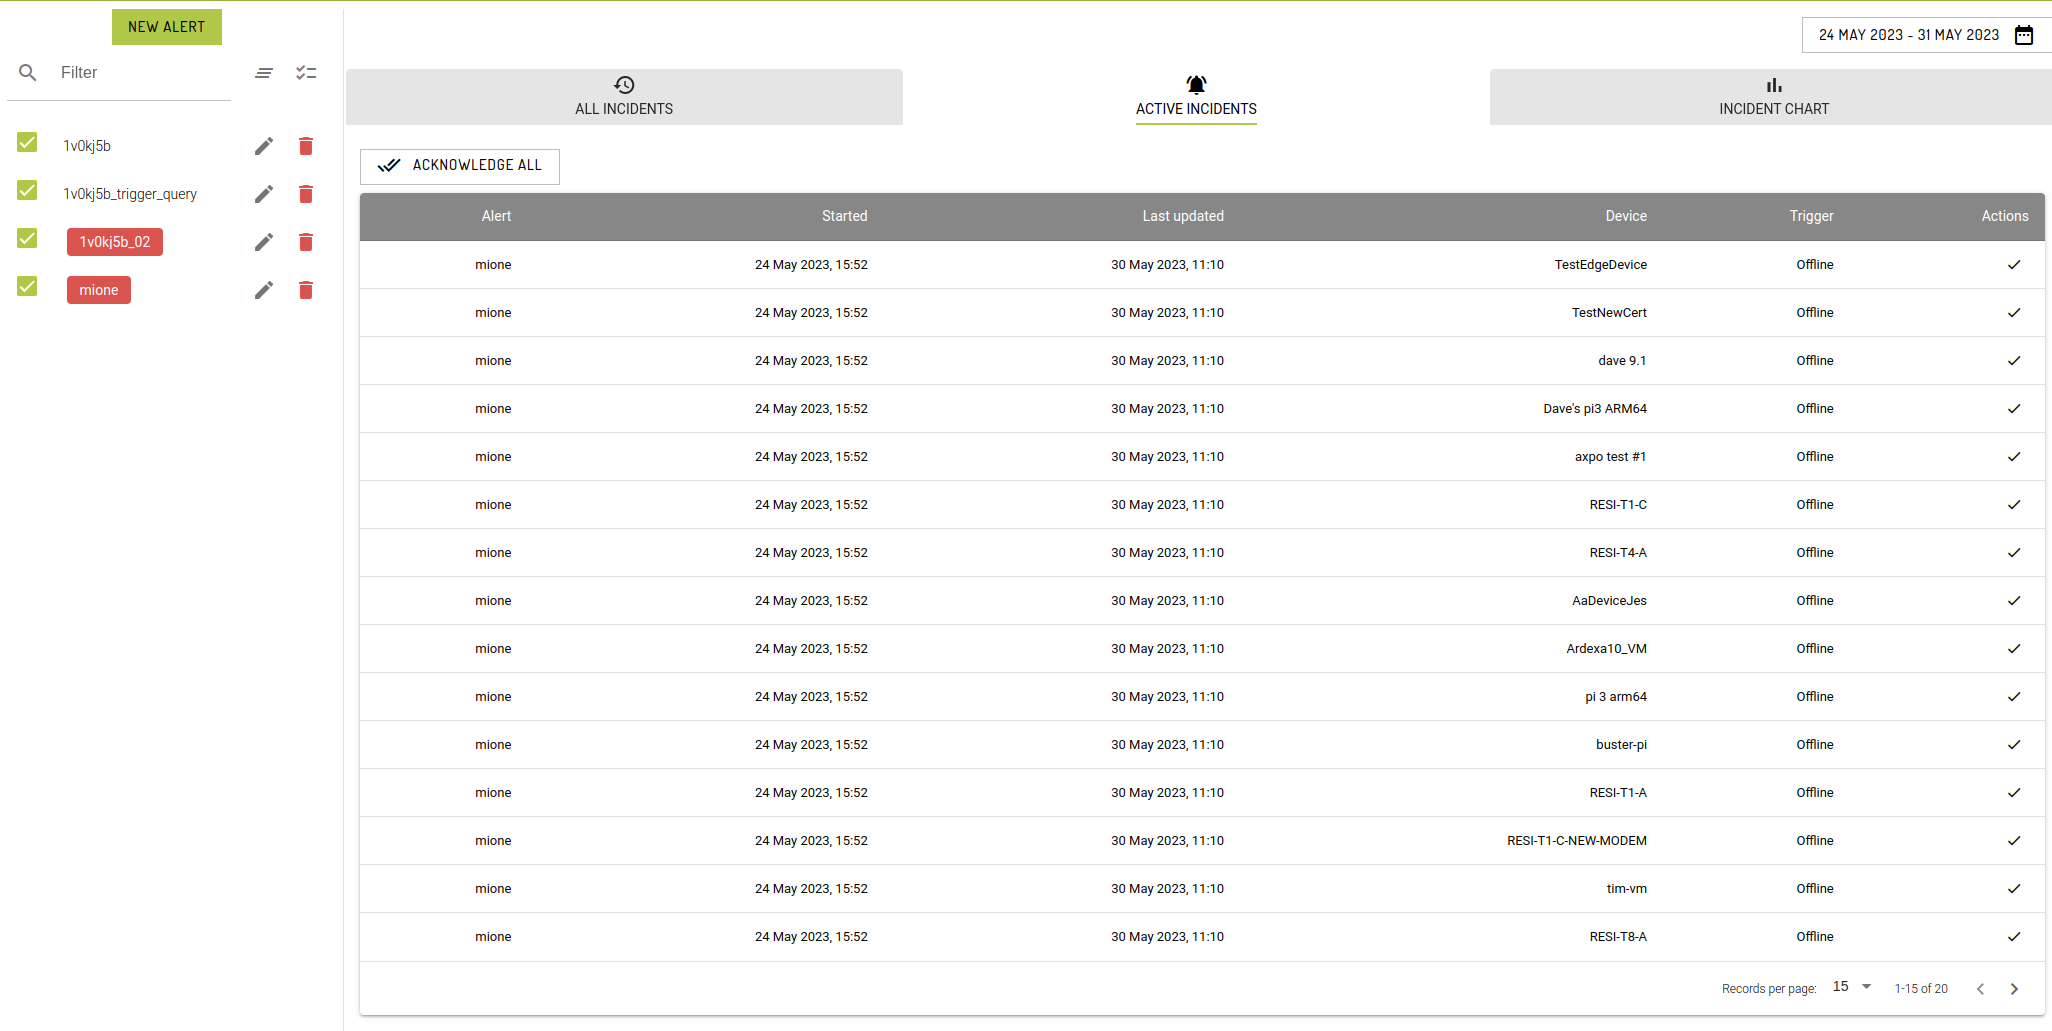
Tab: Active Incidents
The ACTIVE INCIDENTS tab displays all the current active incidents for the corresponding Alerts selected on the LHS.
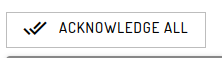
In this view you may acknowledge Incidents individually or all at once.
NB. The incidents displayed in this view are a different subset of records to the historical records in ACTIVE INCIDENTS or INCIDENTS BY CHART , hence some discrepancies may be observed.
Incident concepts are further expanded in the section below, here.
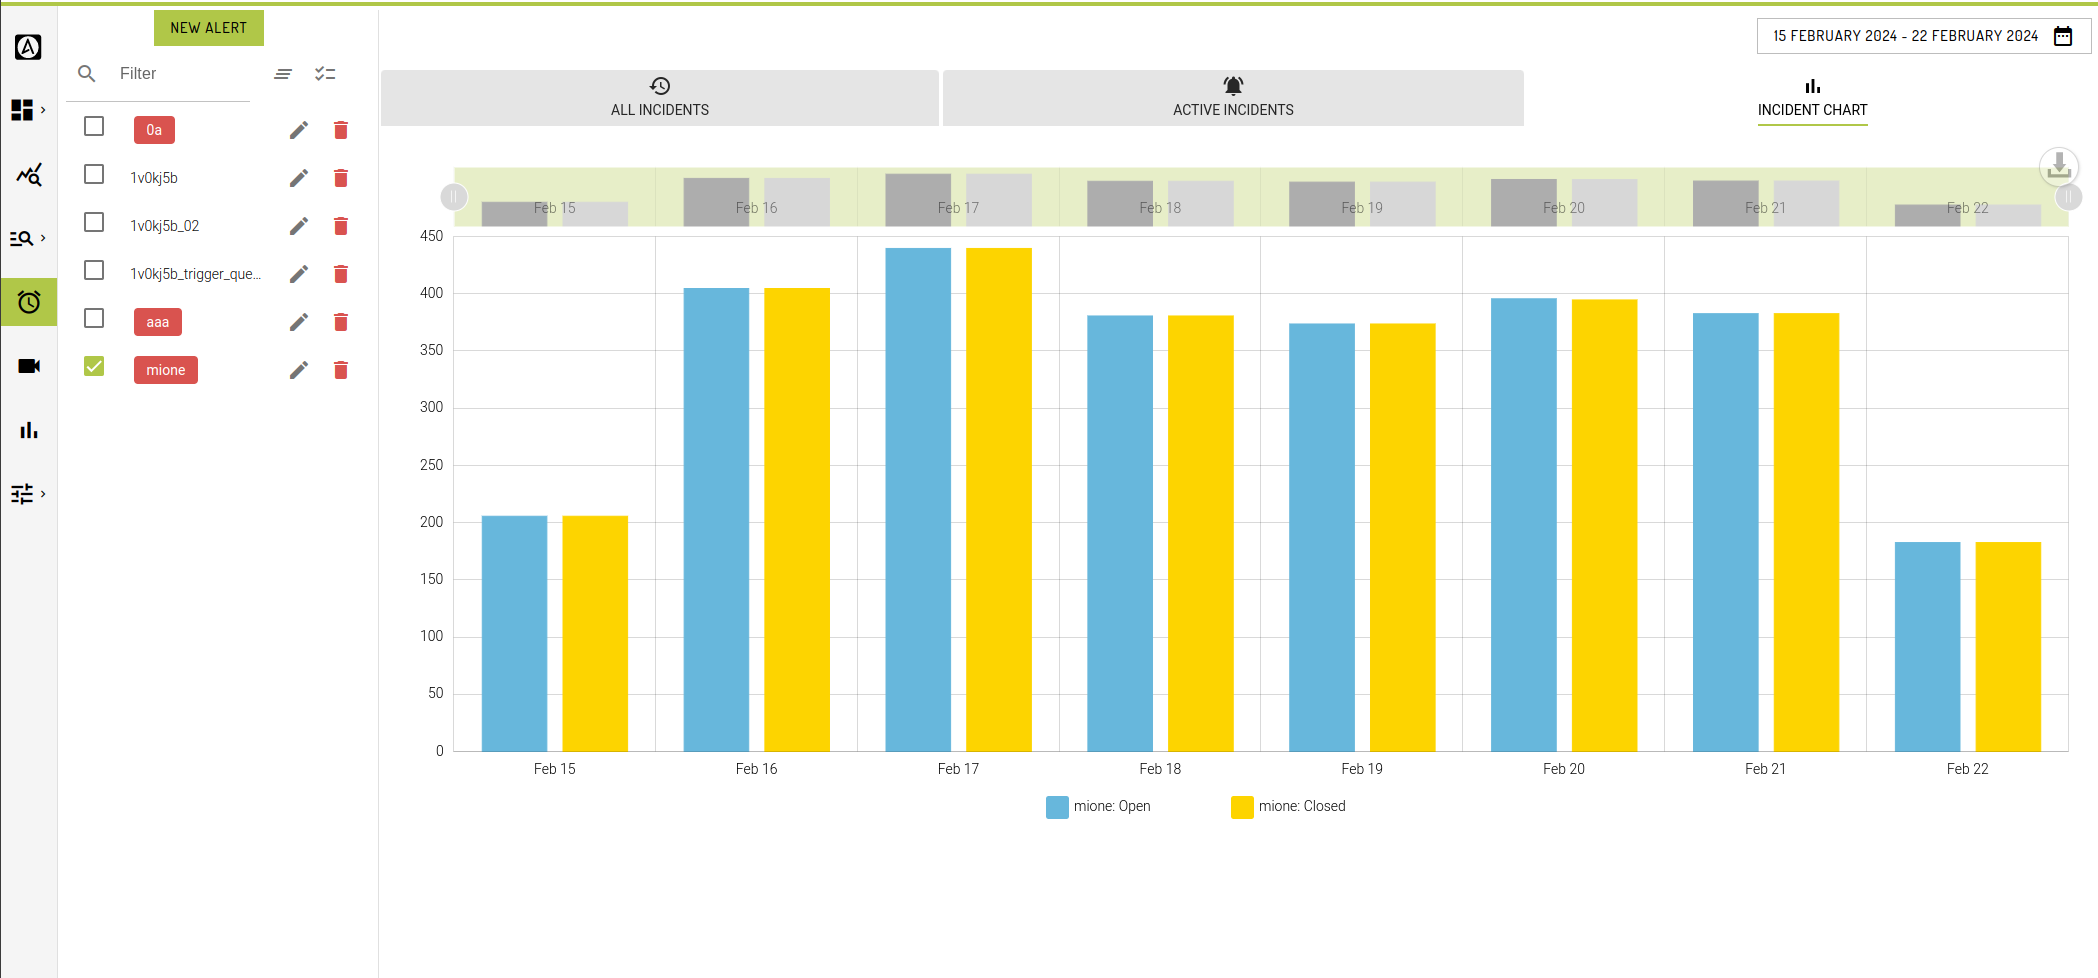
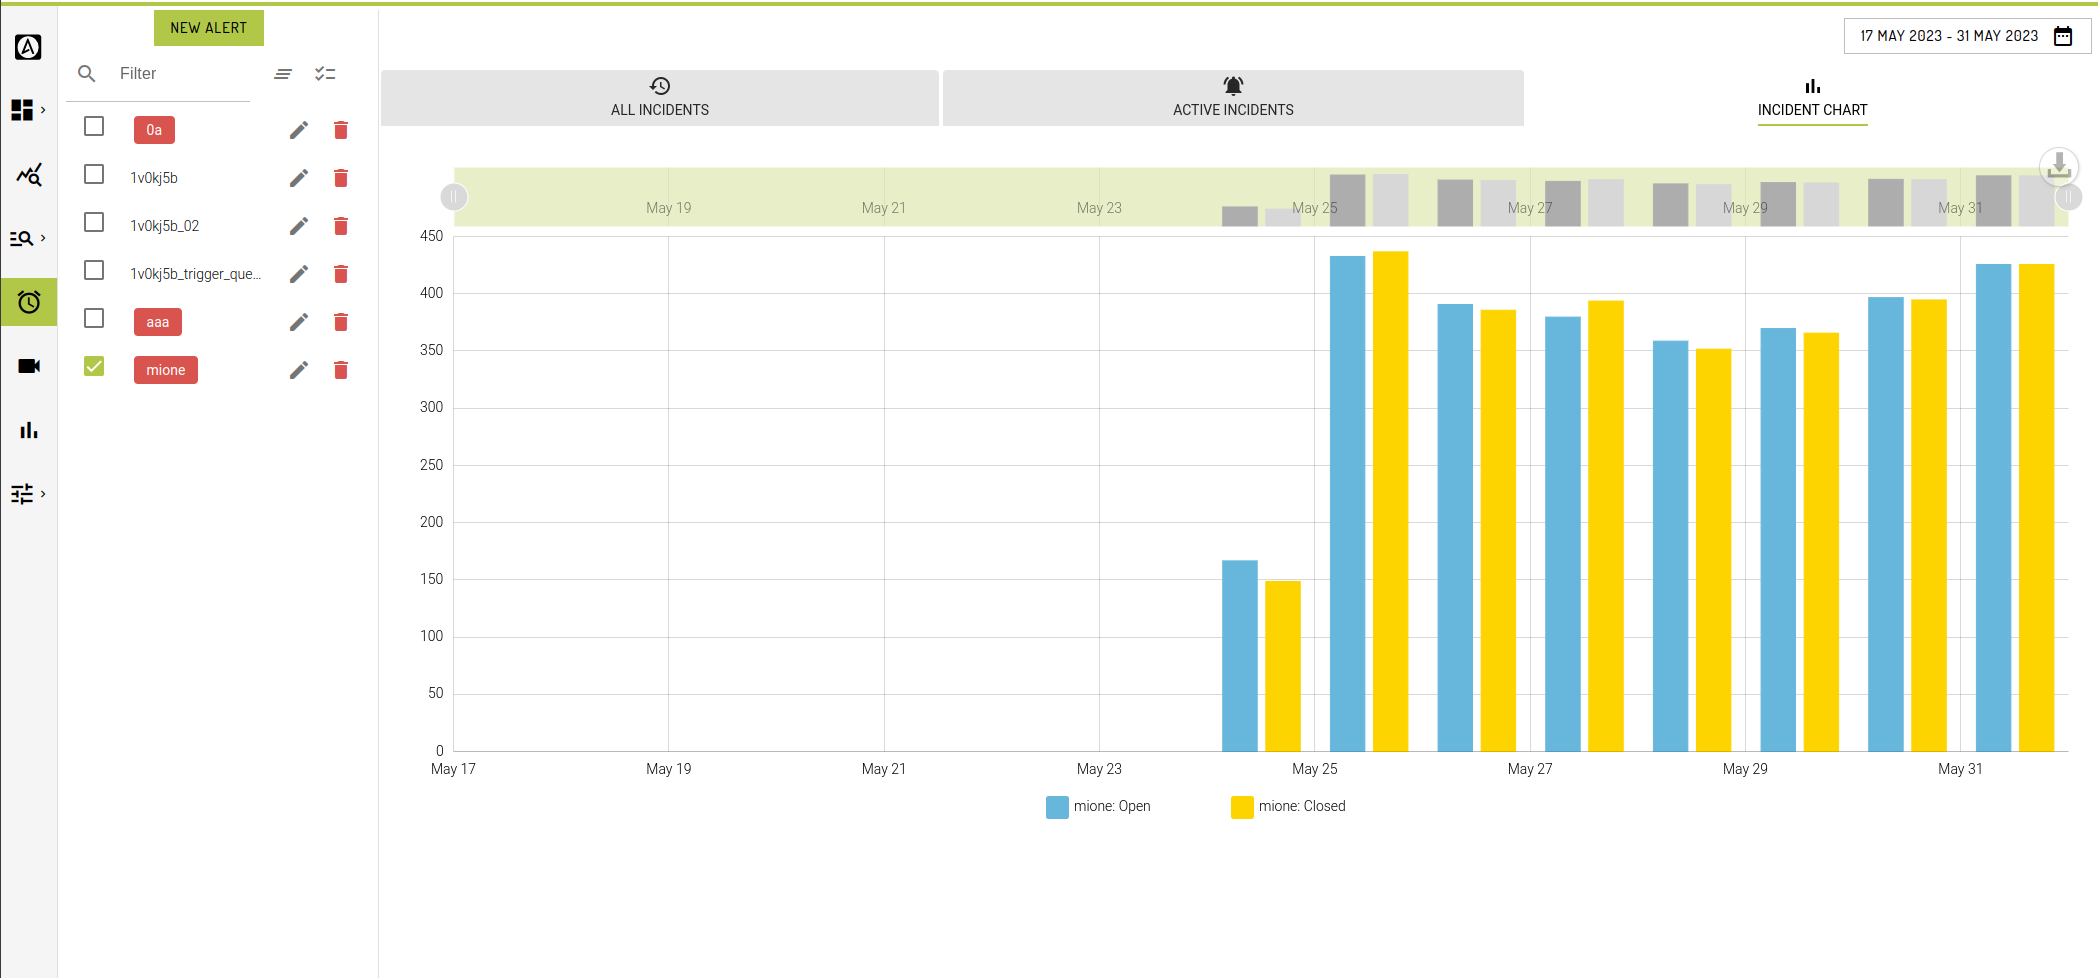
Tab: Incidents By Chart
Create and select an Alert on the LHS selection pane to begin charting your historical Incidents stored in the incident_logs table.
Timeframe
Choose an appropriate period via the timeframe picker to chart incidents.
You can chart the incidents of many alerts at the same time.
Incidents are charted by predefined aggregates based on the time period you choose.
If a predefined timeframe doesn't suit your needs then you can choose a custom value.
Hint: if your alert produces no incidents, then the chart will be empty
Hint: timeframes do not apply to the Active Incidents Tab
Prerequisites
Some Alerting features depend on other configuration items being present in the workgroup.
Device Groups
Alerts can be applied to all devices in a workgroup, or to a specific subset of devices defined by a Device Group. See Device Groups for more information, or navigate to: Admin -> Workgroup -> Device Groups Tab
Source Labelling
Query & Absent Data alerts are applied to device sources with a specified source label.
Hint: [SOURCE MANAGEMENT] is accessed from the menu:
Admin -> Workgroup
Where you can define:
Rules
Sources
Dashboard settings
Permissions
Alerts can be viewed by any user in the workgroup with the 'Read' permission. In practice, this is all users in the workgroup.
Alerts can be created, updated and deleted by users with the 'Coordinate' permission.
Users attached to a specific Device Group have some additional restrictions when interacting with Alerts:
Device Group users can only see Alerts configured against their Device Group
Device Group users with the 'Coordinate' permission can only create, update & delete Alerts configured against their own Device Group
Device Group users are unable to edit Source labelling settings. They can, however, use pre-existing source labels to configure Alerts.
Creating an Alert
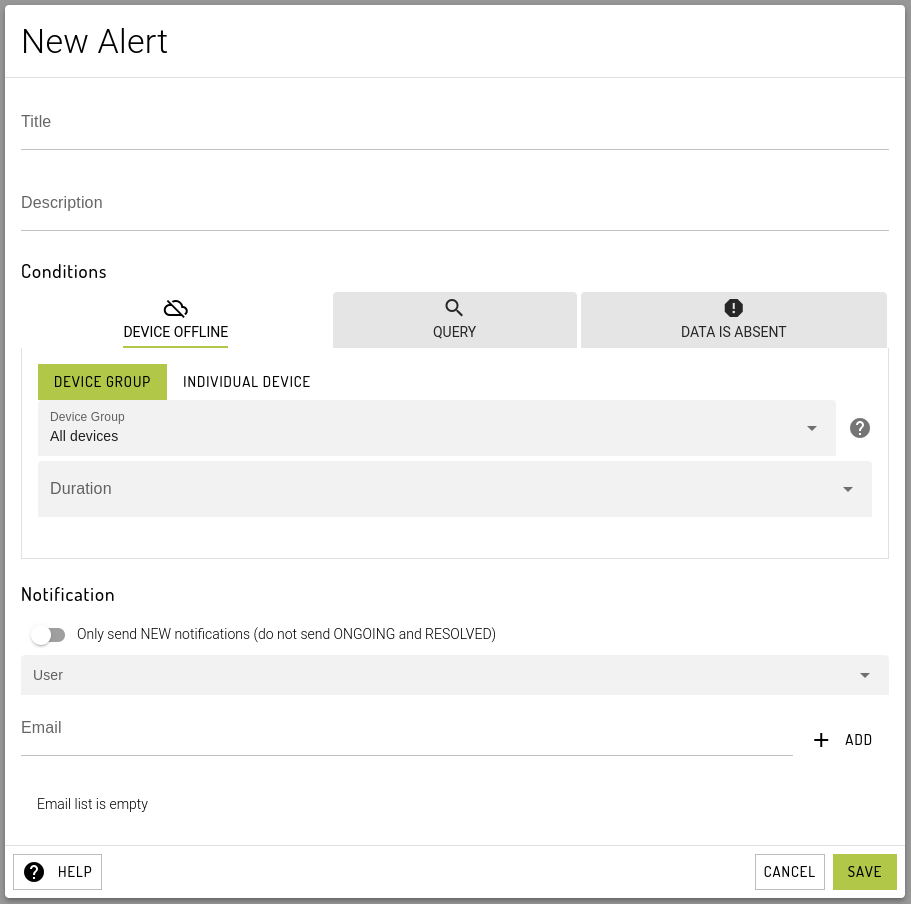
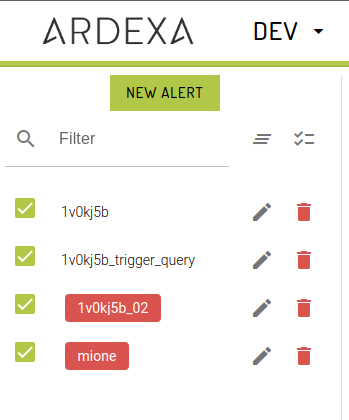
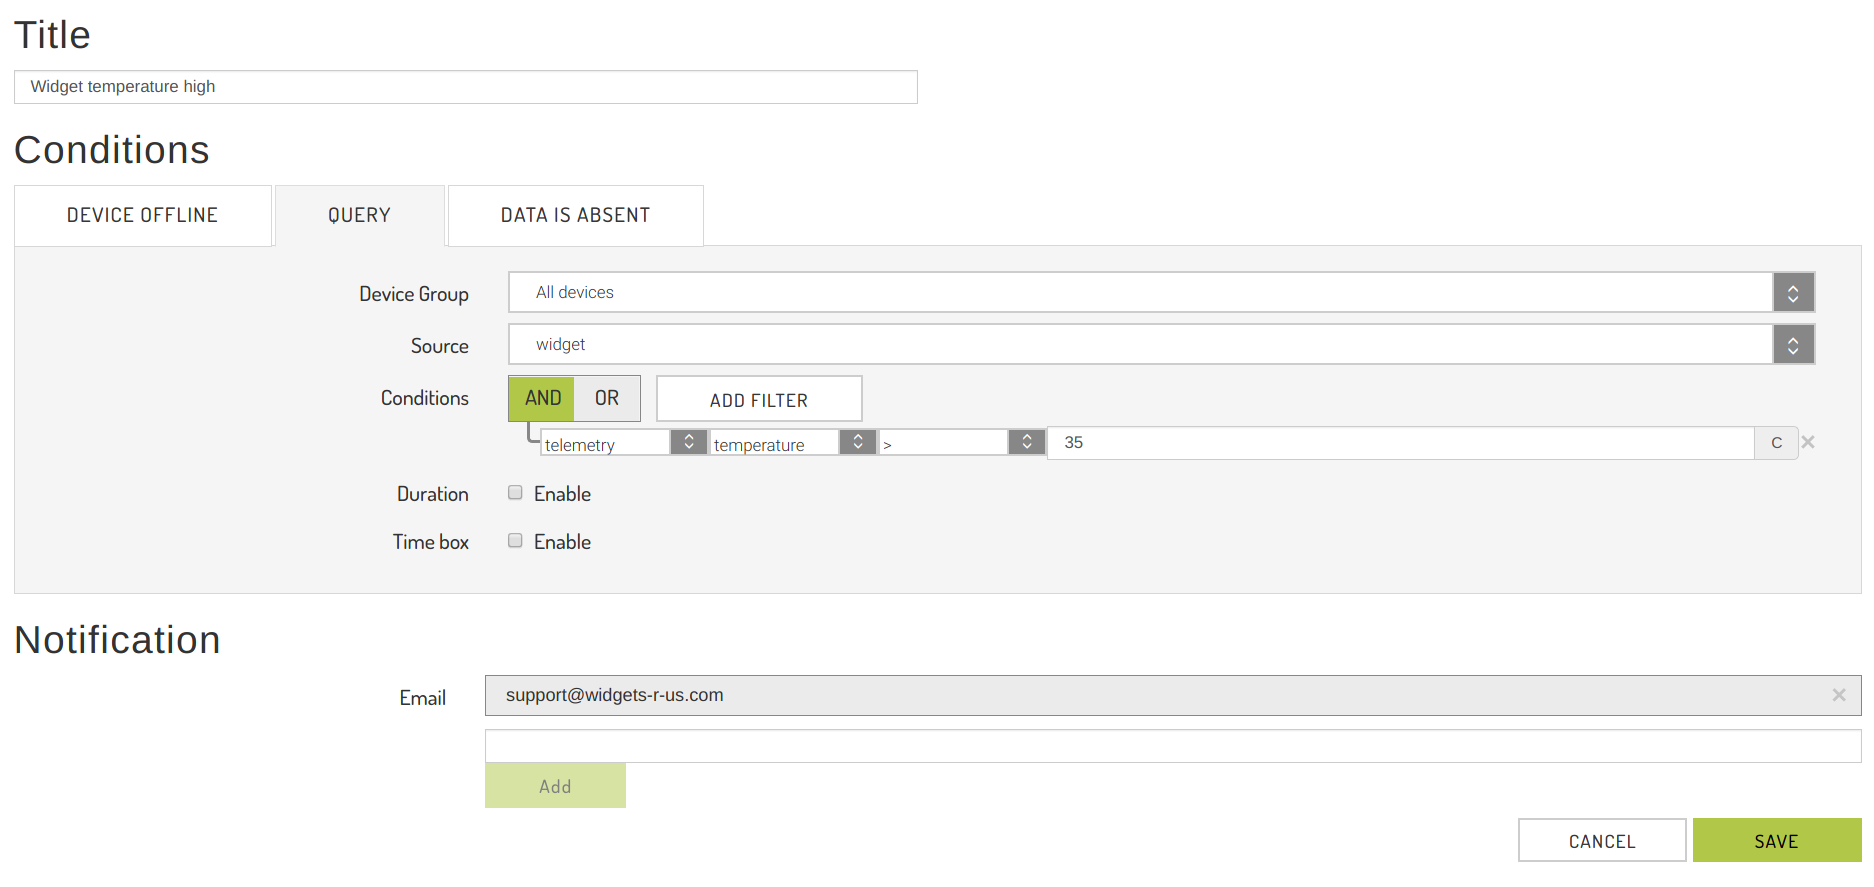
To create an Alert, click on the [NEW ALERT] button toward the top of the page on the LHS. Give the Alert a descriptive, unique title.
To add a notification email address, enter the address in the email list & click the Add button. Clicking the small cross on the right of an email address will remove the address from the notification list.
Once you are satisfied with the configuration of your Alert, click the [SAVE] button to create it. This will initiate monitoring of the Alert condition in the cloud immediately.
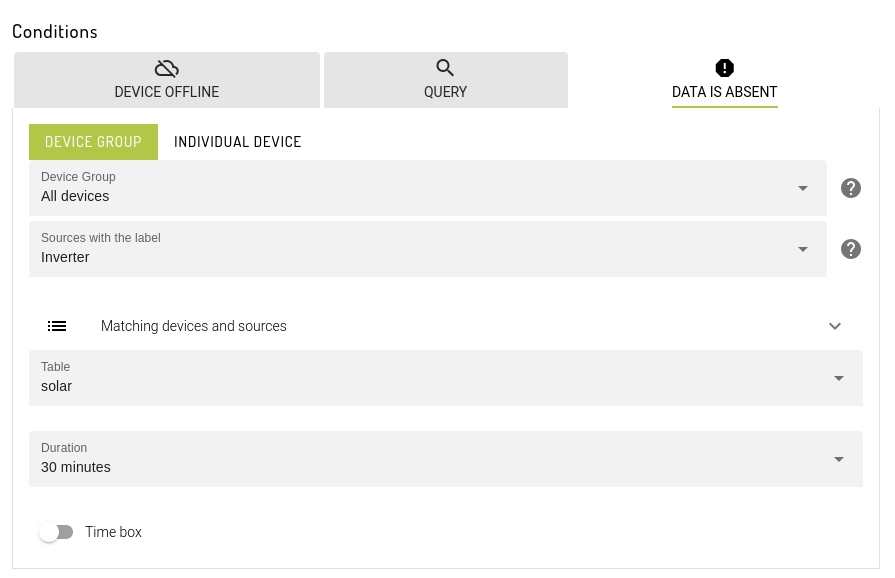
The three alert types you may choose from:
1. Device Offline Alert
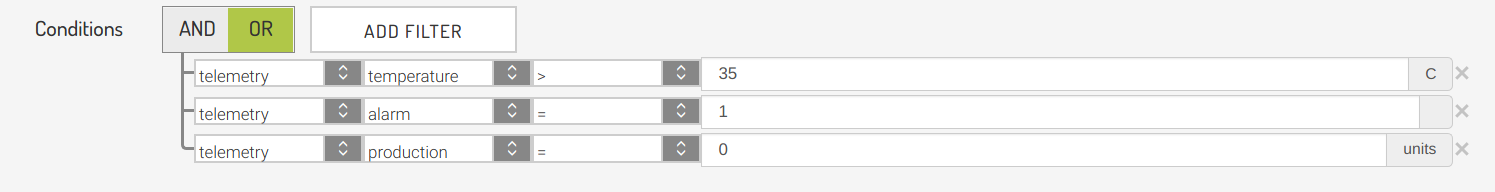
2. Query Alert
3. Data is Absent Alert
are expanded in the following:
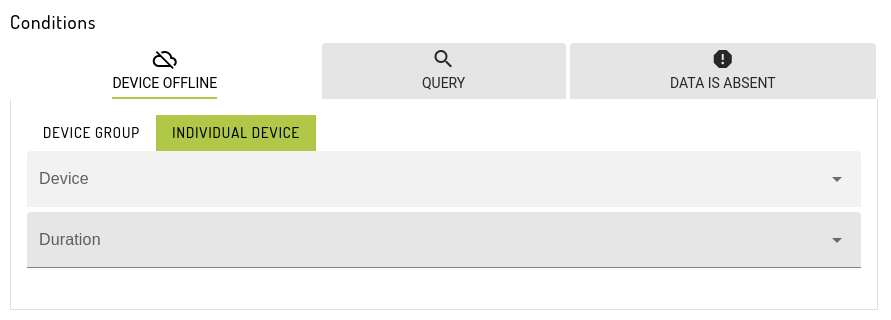
Creating a Device Offline Alert
Device Offline Alerts will trigger when an agent has been offline (ie. unable to connect to the Ardexa Cloud) continuously for a defined period of time.
To configure a Device Offline Alert, in addition to Title & Email addresses, you will need to specify:
A
[Device Group]which you would like to alert on, orAll Devicesin the workgroupThe Device Offline
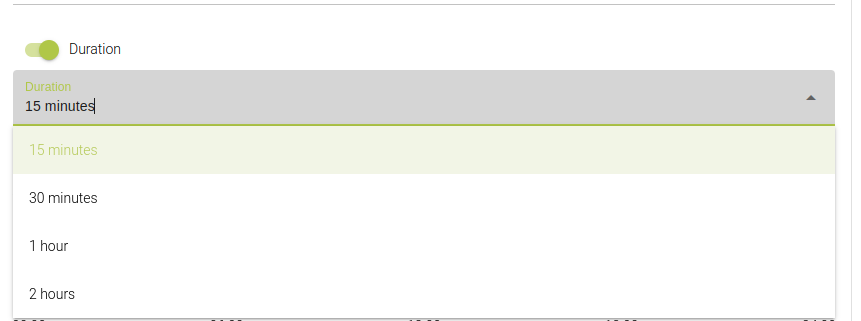
[Duration], with options ranging fromImmediatelytoOffline more than 1 day
Editing Alerts
To edit an Alert, select the pencil icon on the right side of the alert list.
This will open the same pop-up dialogue box as used for creating a new alert.
Make the required changes and click [SAVE]. Clicking [CANCEL] will discard your changes.
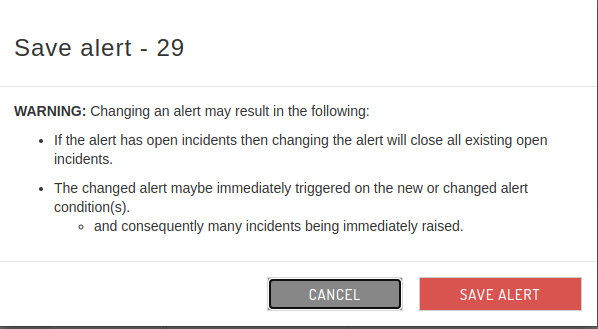
Note: Affect on Incidents when Editing Alerts
Editing an Alert will delete any related Incidents raised by the Alert.
However, historical logs of these incidents, stored in the incidents_logs table are not deleted and will still be available from the [SEARCHES] interface.
Editing an Alert may also immediately trigger/re-trigger conditions that raise incidents, resulting in possibly in multitudes of incidents being raised at once.
Deleting Alerts
Help in Alerts
Incident Concepts:
Active Incident
An active incident represents a condition that is not yet resolved. When it becomes resolved it will be closed. When closed it can always be viewed as a record entry in the incidents_logs table.
A notification is set on the parent Alert of the Incident, eg. an email, then you will be advised until the Incident is Acknowledged.
Acknowledged & Unacknowledged Incident
An active incident as an acknowledge/unacknowledge status. While an incident is unacknowledged you will be notified if a notification is set on the parent Alert.
Note: Acknowledging an Active incident does NOT close the incident. It will remain open until the condition is resolved.
Incident Logs
The history of all raised incidents, active/closed/acknowledged, are stored in the incident_logs table.
These can be viewed through the [SEARCHES] view or graphed via the [INCIDENTS BY CHART] tab in the [ALERTS] view.
Viewing & Acknowledge an Alert's Active Incidents
When an Alert's conditions have been met for a particular source, the Alerter process in the Ardexa Cloud will raise an Incident for the Alert. Any single Alert may have many Incidents.
To view your active incidents navigate to the [ACTIVE INCIDENTS] tab from the [ALERTS] view.
Select Alerts to View their Active Incidents
Select the Alerts whose Active Incidents you wish to View
This view displays all the active incidents for every selected alert on the LHS.
Note: if your selected alert has no active incidents then the table will be empty.
Acknowledge an Incident
Acknowledging Incident concepts are provided here.
Email Reminders
When a near real time alert is triggered, that is to say the conditions are met for an alert, it will send an email alert to the identified recipients. A resolved email will be sent when the conditions no longer meet the alert criteria. If condition is still active, a reminder email will be sent every 2 hours, 1 day or 1 week. The default is 2 hours, but it can be changed by navigating to: Admin -> Workgroup -> Settings Tab
and changing the Alert reminder setting.
Source
For Query or Data is Absent alerts, you will need to specify a data source. Sources are 1 or many streams of information coming from 1 or more device. Labeling data sources make it much easier for someone to understand the data coming in, without having to understand the underlying data structures coming from the device. Label the source(s) of data, from the device(s), by using the settings in:
Admin -> Workgroup -> Labelling Tab
Data is Absent
This alert type reports when data is not being received by the cloud, from the device. If the device is offline, this alert will not be triggered. If an agent is offline, it is assumed that it is functioning, in which case the Ardexa agent will cache all events. When the agent comes back online, all events will be sent to the cloud. If however, when the agent comes back online, the data is not there, then an alert will be raised.
Last updated