Energy Reports
Total Energy
The Total Energy Produced report allows you to view the total energy produced by one or more devices over a selected time frame. This depends on the "Daily Energy" report being configured for your Workgroup. See Configuring the daily energy process for more information.
Report Parameters
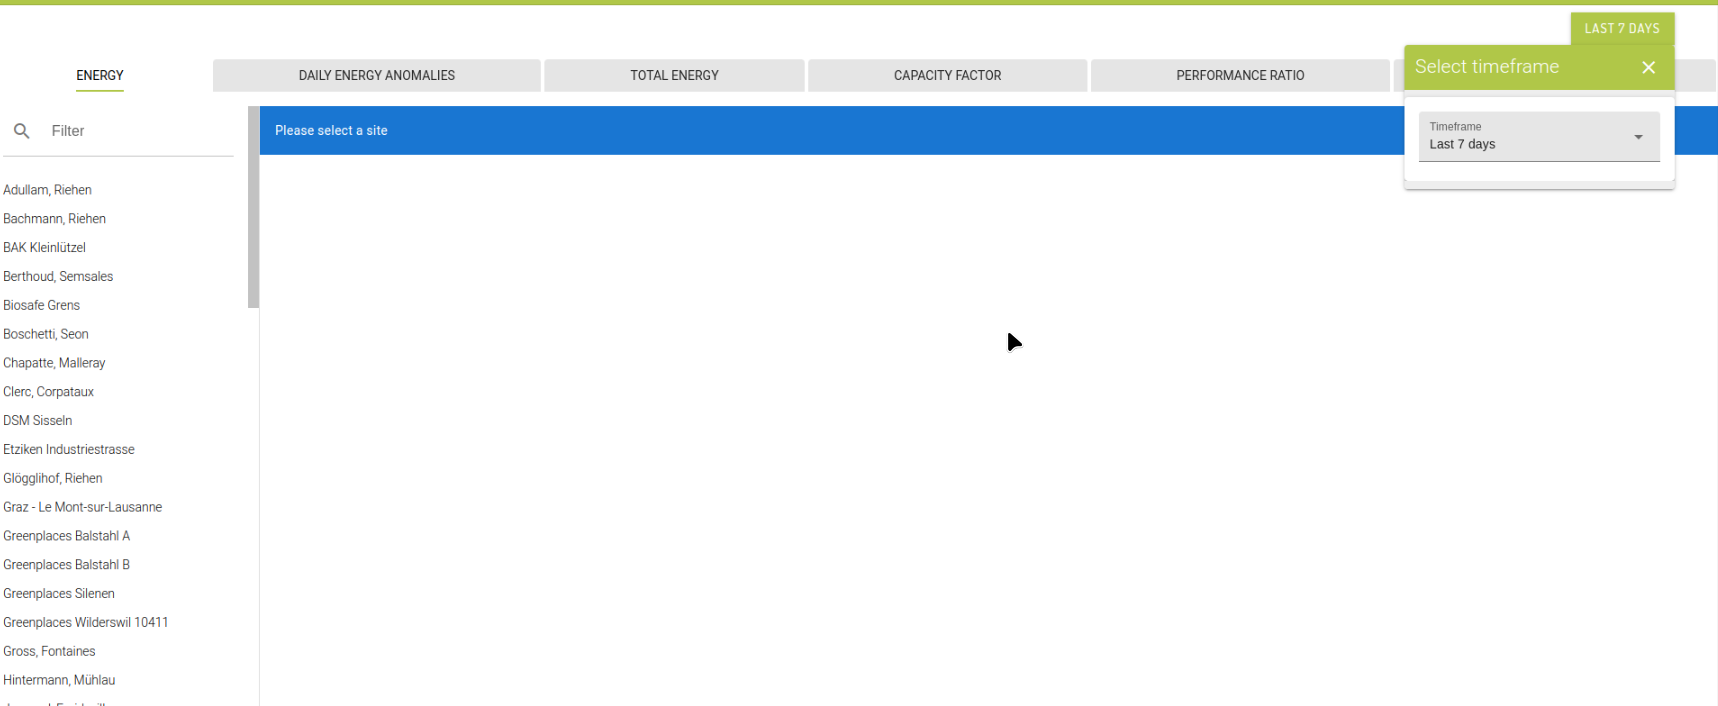
Multiple devices can be selected from the Device selection menu. Once a device has been selected, more display options will be presented. In addition, selecting a site or a device will also be cascaded to the tabs that has the same site/device parameters, which are Energy, Total Energy, Capacity Factor and Performance Ratio.
Display
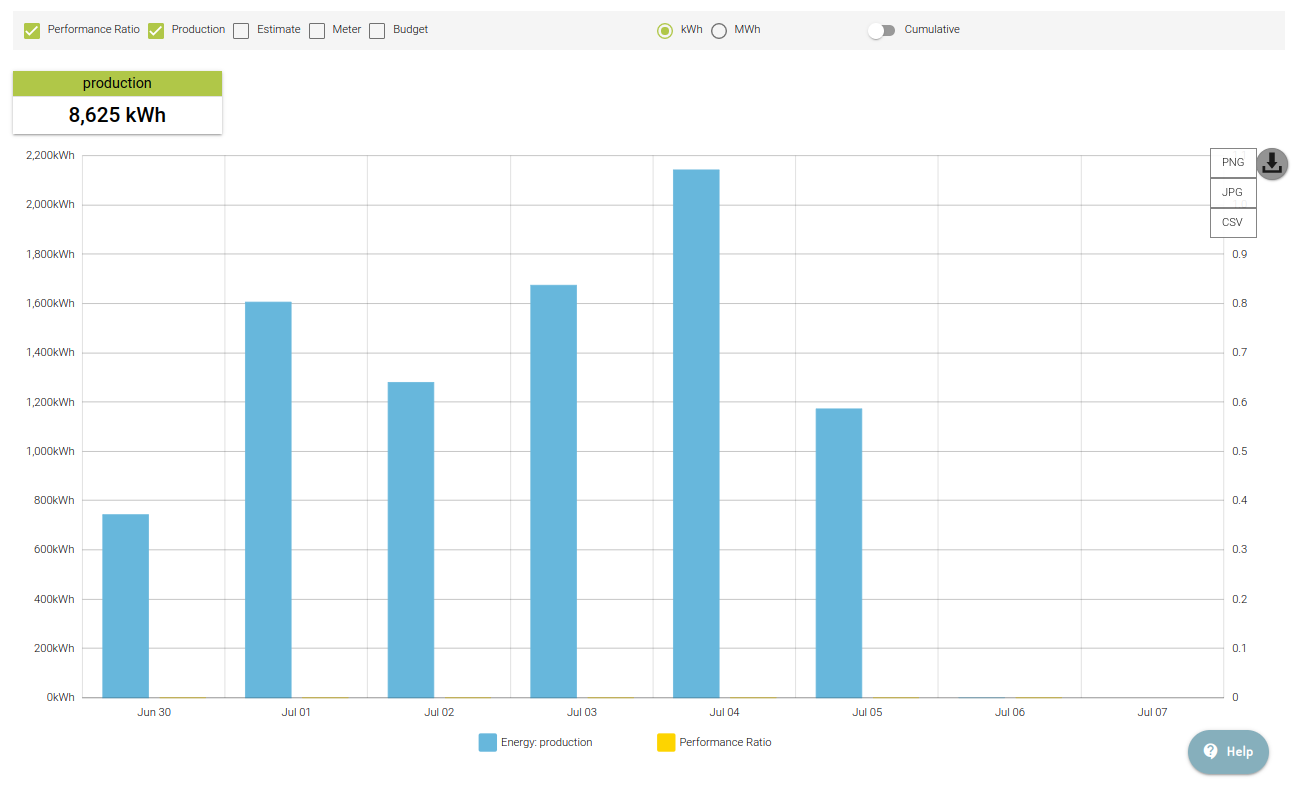
Total / per Device: Total will display the total energy generated by all selected devices. per Device will display a total energy value for each individual Device
kWh / MWh: sets the scale of the results
Timeframe: sets the report timeframe. Report tabs has the default to 7 days. Any options selected will be set for all report tabs.
Options are:
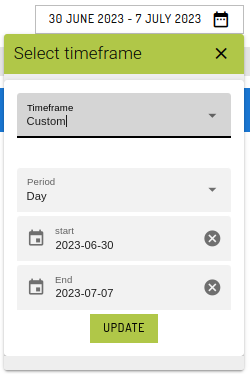
Presets: Last 7 days, Last 14 days, Last 30 days, This week, Last week, This month, Last month, Last 12 months, This calendar year, Last calendar year and Custom
Custom: Select Period (Day, Month, Year) and Start & End dates
Download
At the top-right of the chart, a download button will be available for saving chart's results into 3 different formats: PNG, JPG and CSV.
Performance Ratio
This report will display the energy produced (via the Daily Energy process) compared with the estimated energy for a given device over a selected time frame.
To use this report, energy estimates will need to be configured for your workgroup.
Display Options
Plant / Inverter: Plant will display the total energy produced vs estimate over an entire plant. Inverter will display a breakdown of estimate vs actual energy for each inverter at the selected plant.
kWh / MWh will set the scale of the report.
Timeframe
This option set the report timeframe. Options are:
Week: display a daily energy value for each day of the selected week
Month: display a daily energy value for each day of the selected month
Year: display a total monthly energy value for each month of the selected year
Meter Data
This report displays the actual energy production calculated by the Daily Energy process in the Ardexa Cloud with externally-sourced energy meter data.
The plant selector on this report is based on Meter Sites, not devices. See Configuring Meter Data for a description of Meter Sites.
Budget Data
This report displays the actual energy production calculated by the Daily Energy process in the Ardexa Cloud with externally-sourced energy budget data.
The plant selector on this report is based on Meter Sites, not devices. See Configuring Meter Data for a description of Meter Sites.
Last updated