Dashboards and Labelling
In large workgroups containing common device configuration patterns, the labelling system can be used to configure dashboards with minimal effort.
Concepts
Dashboard levels
Workgroup: a dashboard that can display information from the entire workgroup
Device: a dashboard intended to display information from an individual device
Source: a dashboard intended to display information from an individual source on an individual device
When a device contains a source hierarchy, nested source-level dashboards will be generated.
Example
For this example, we will use a fictional workgroup that uses Ardexa to monitor widget production at a number of factories. Each factory contains multiple zones, each containing multiple modules which produce widgets.
For each factory, we would like to have a dashboard displaying a factory-level overview, with the ability to drill down and inspect each zone and each individual module.
The hierarchy at our first example factory with two zones would be:
zone-1 (Alarm state, Input voltage)
zone-1-module-1 (Production, Temperature, Input voltage)
zone-1-module-2 (Production, Temperature, Input voltage)
zone-1-module-3 (Production, Temperature, Input voltage)
zone-1-module-4 (Production, Temperature, Input voltage)
zone-2 (Alarm state, Input voltage)
zone-2-module-1 (Production, Temperature, Input voltage)
zone-2-module-2 (Production, Temperature, Input voltage)
zone-2-module-3 (Production, Temperature, Input voltage)
zone-2-module-4 (Production, Temperature, Input voltage)
Step 1: Labelling devices
Create labels
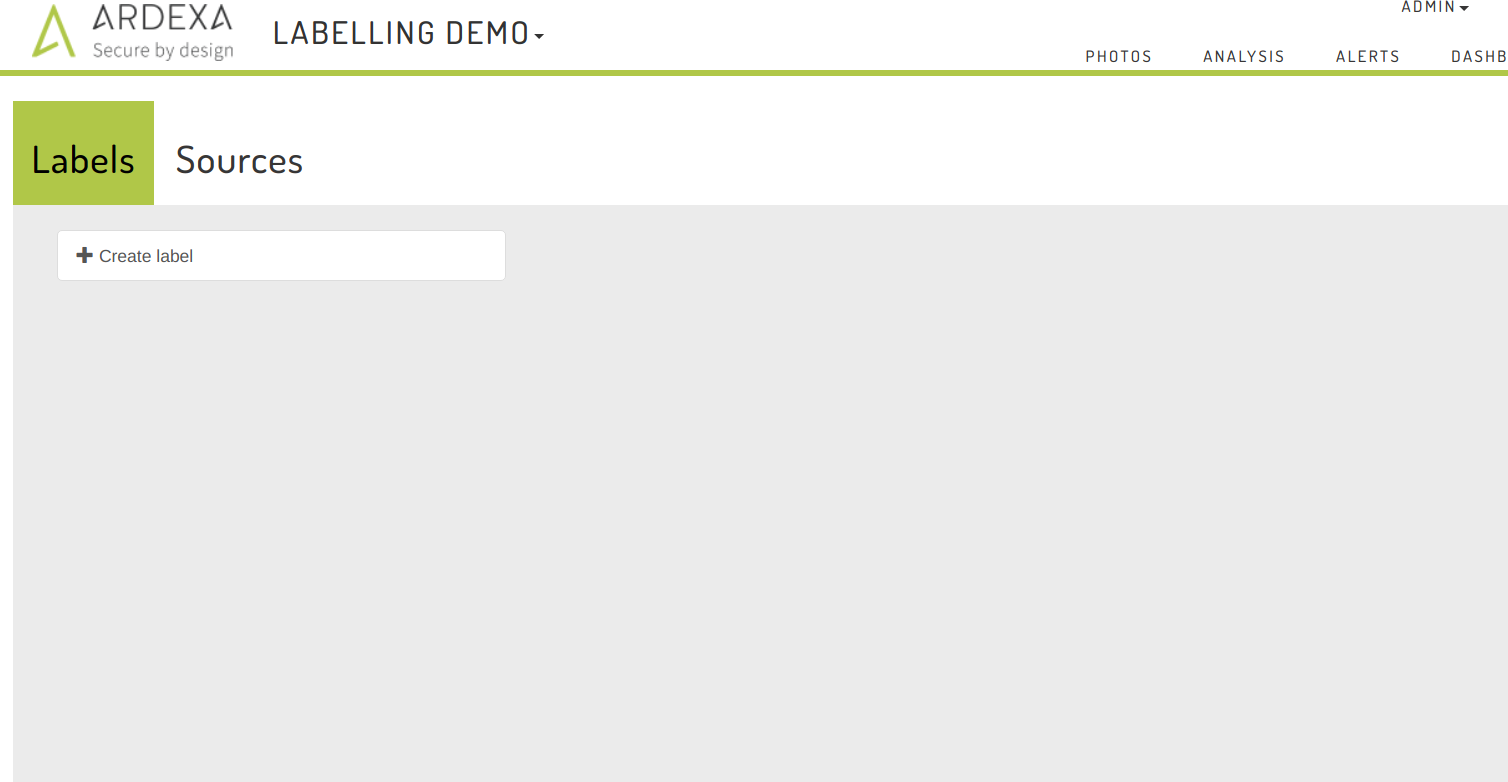
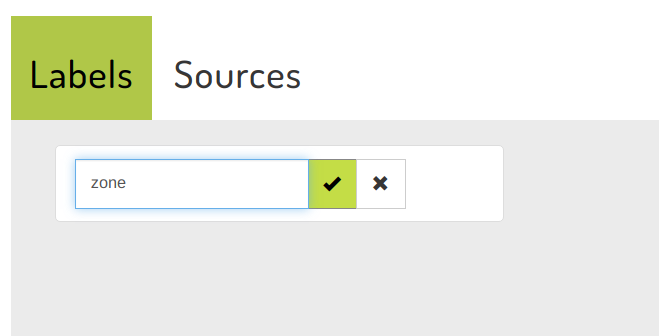
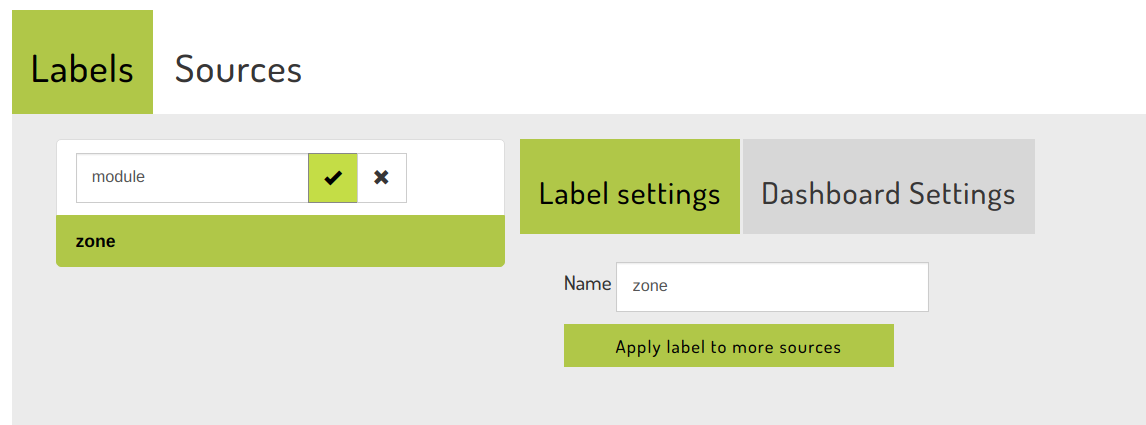
Navigate to the Labelling page, [Admin -> Workgroup -> Labelling]
Create labels: zone and module
Apply labels
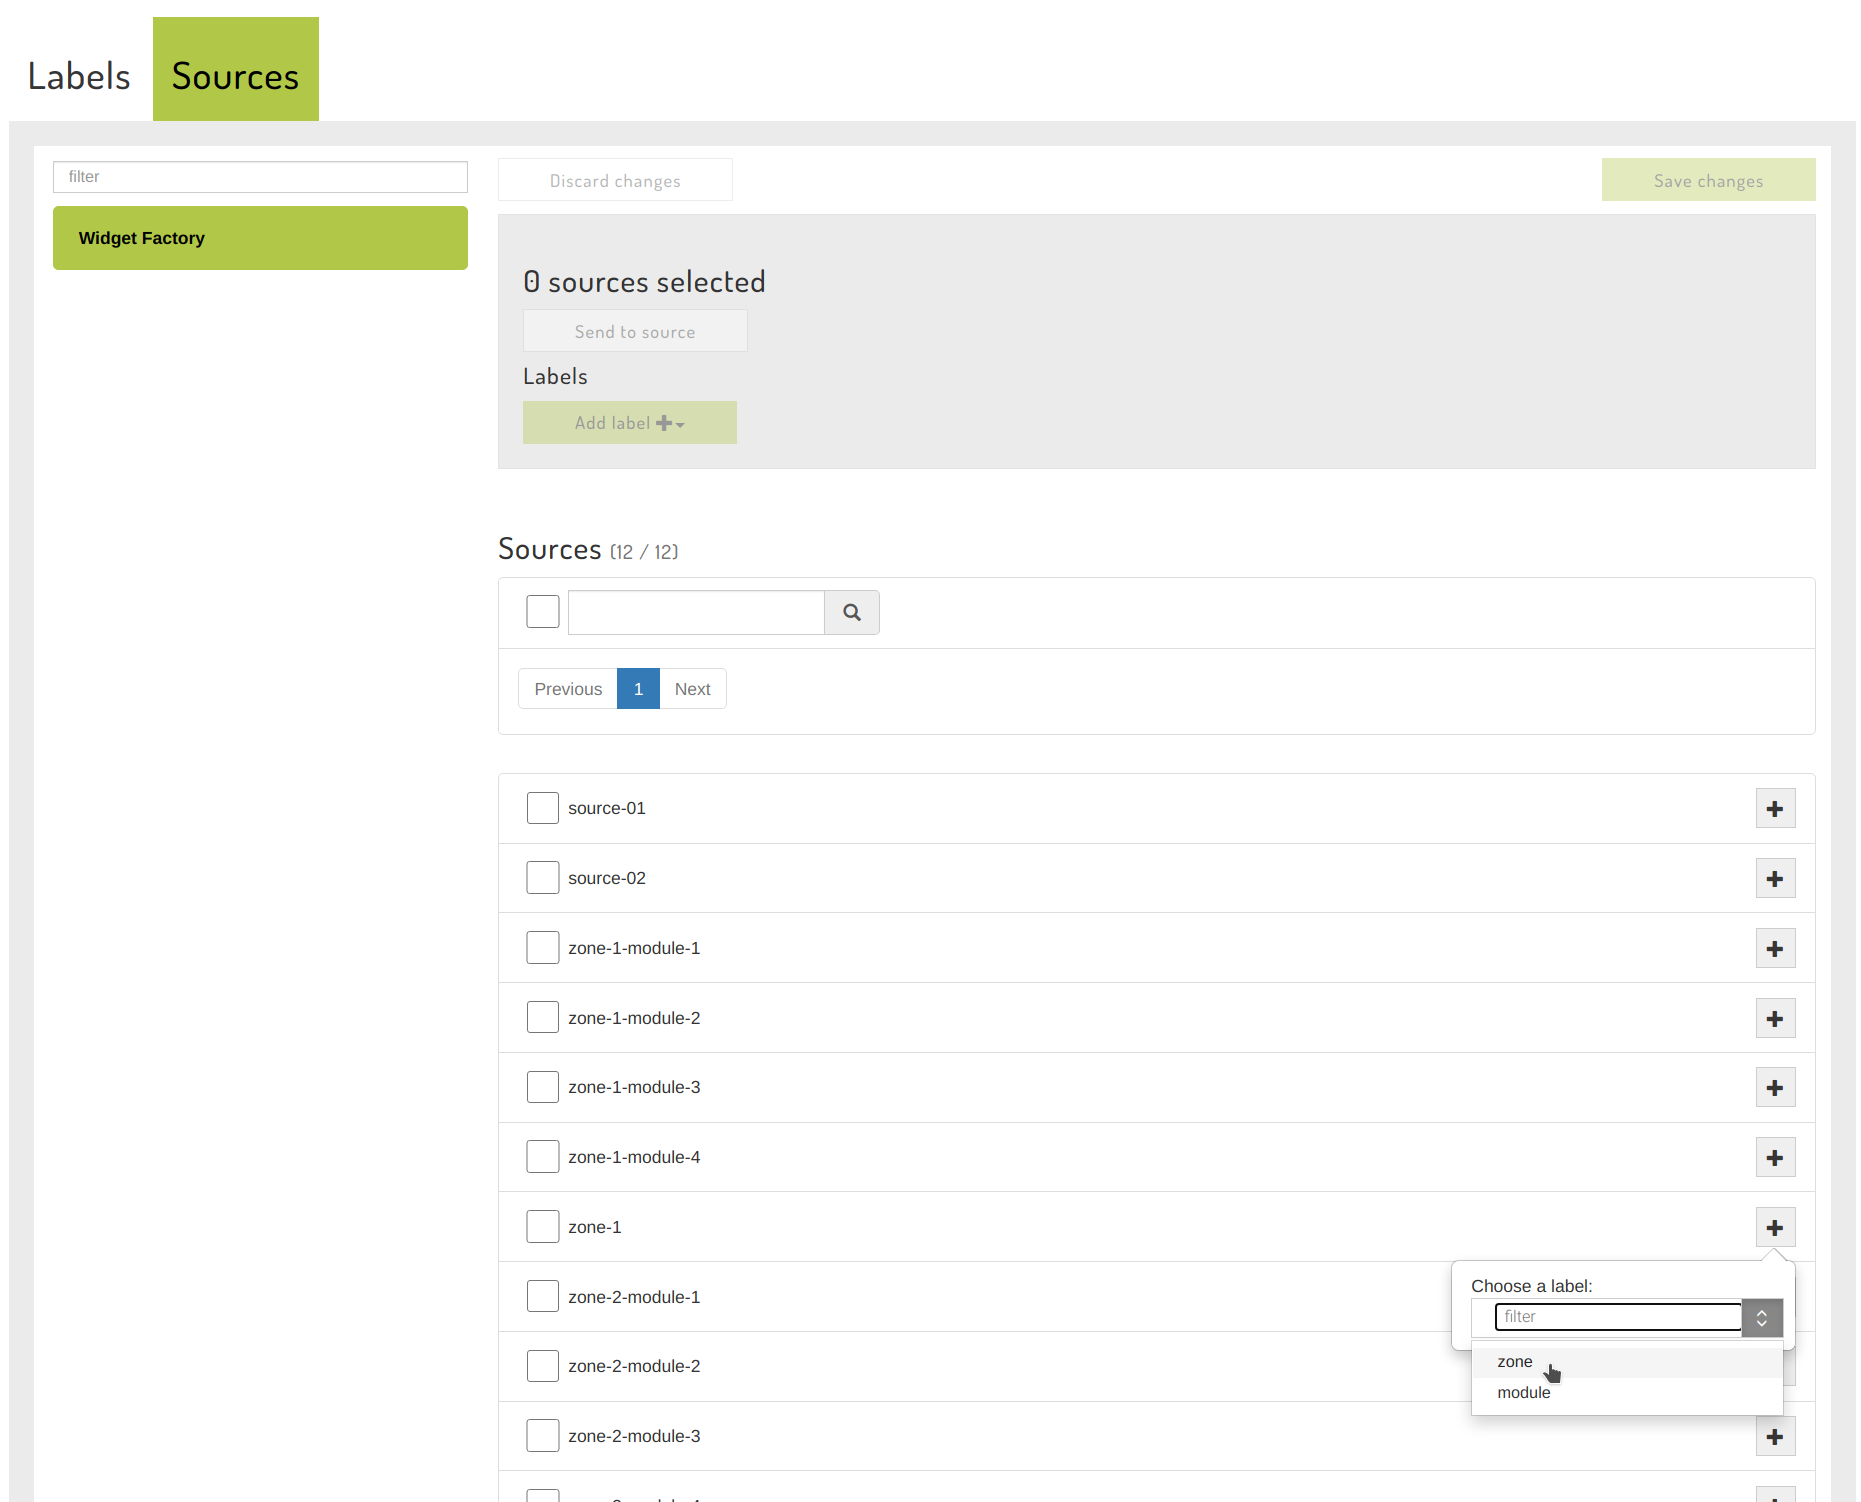
Apply the labels to the relevant sources at our "Widget Factory" device on the Sources tab:
Create source hierarchies
To create a source hierarchy, click and drag the child source onto the parent, eg. zone-1-module-1 -> zone-1. Repeat for each child source. Multi-layer hierarchies are supported.
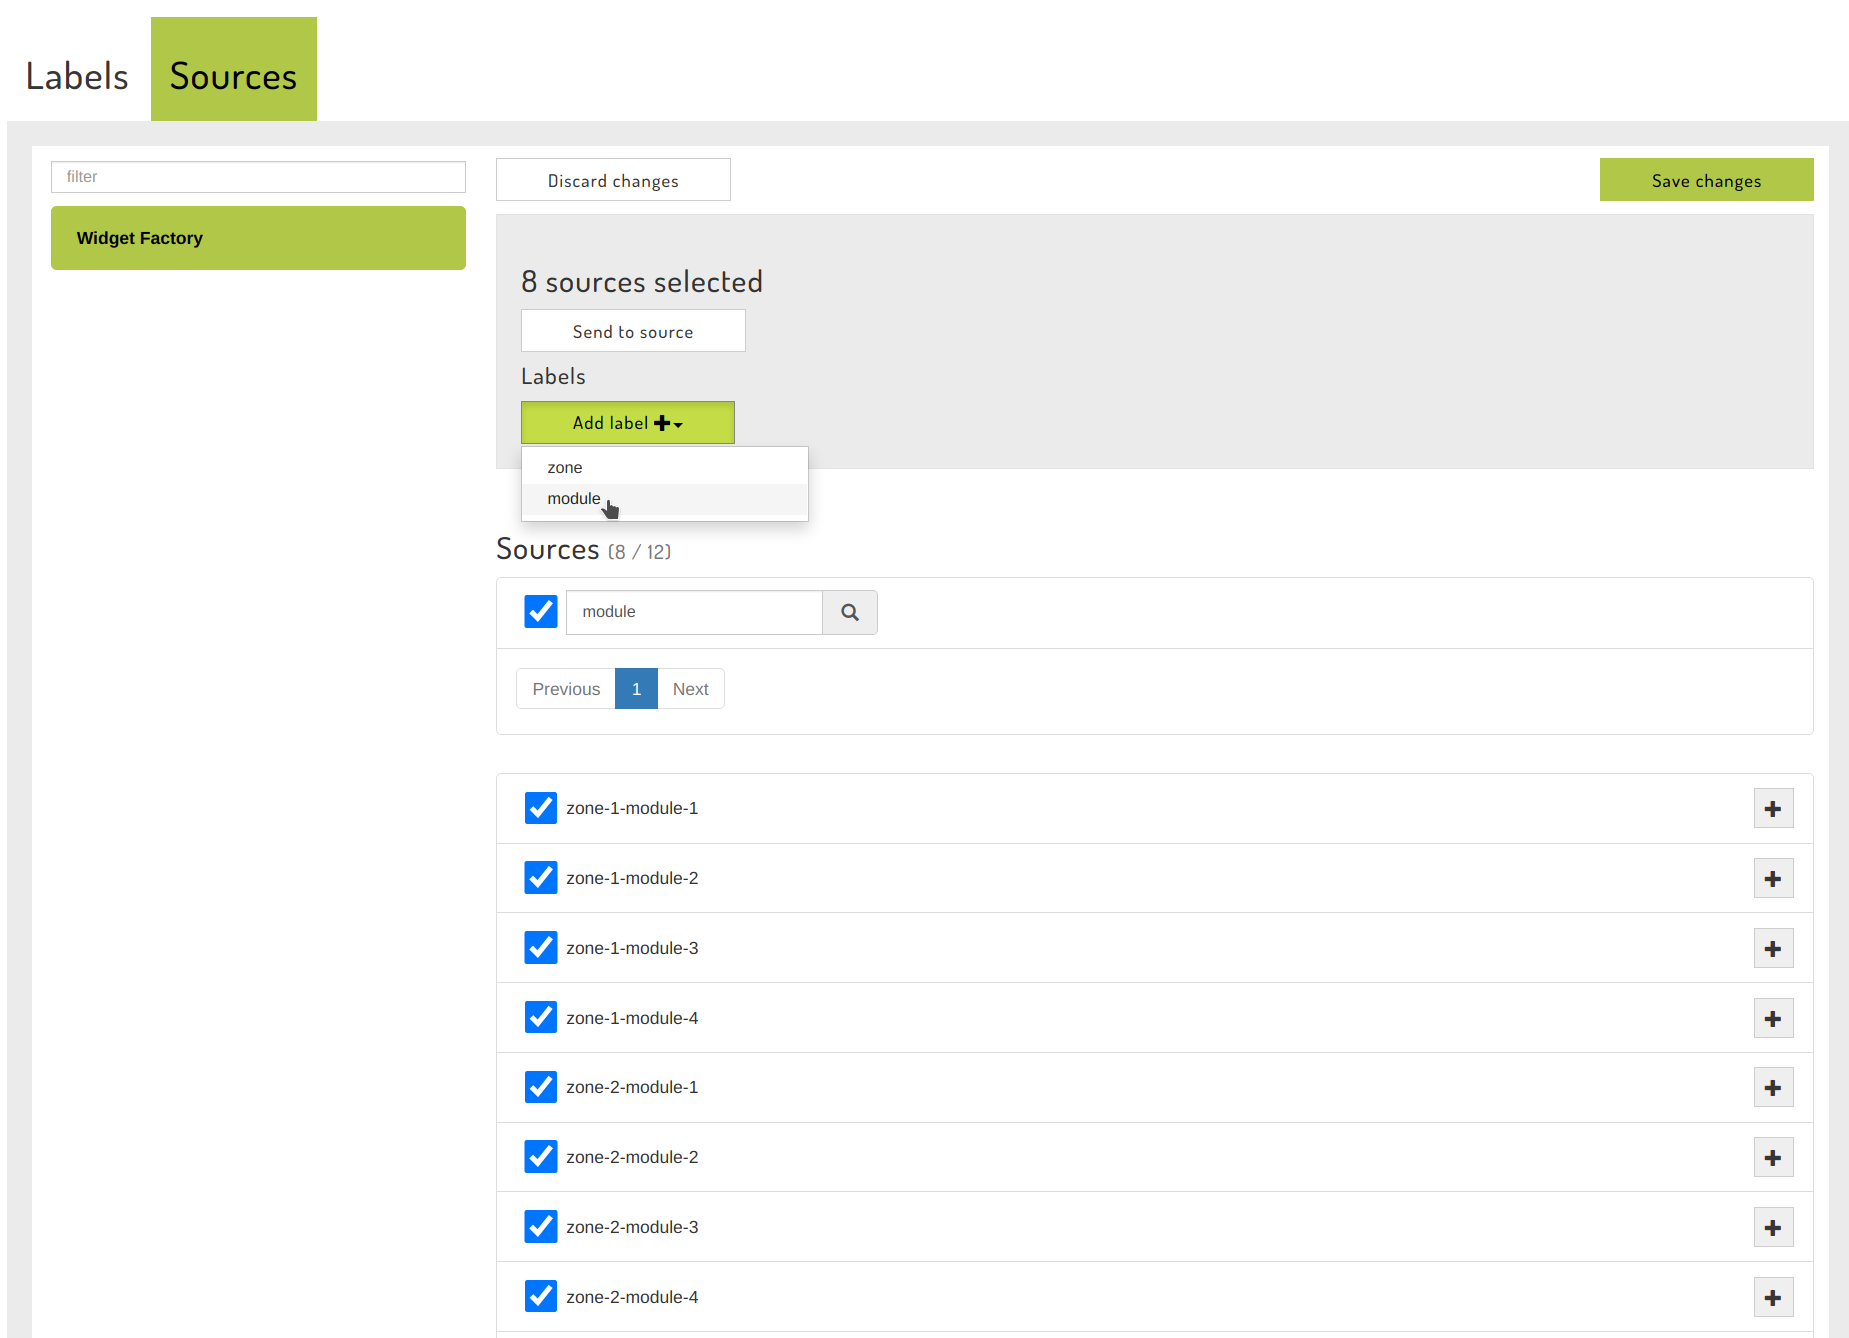
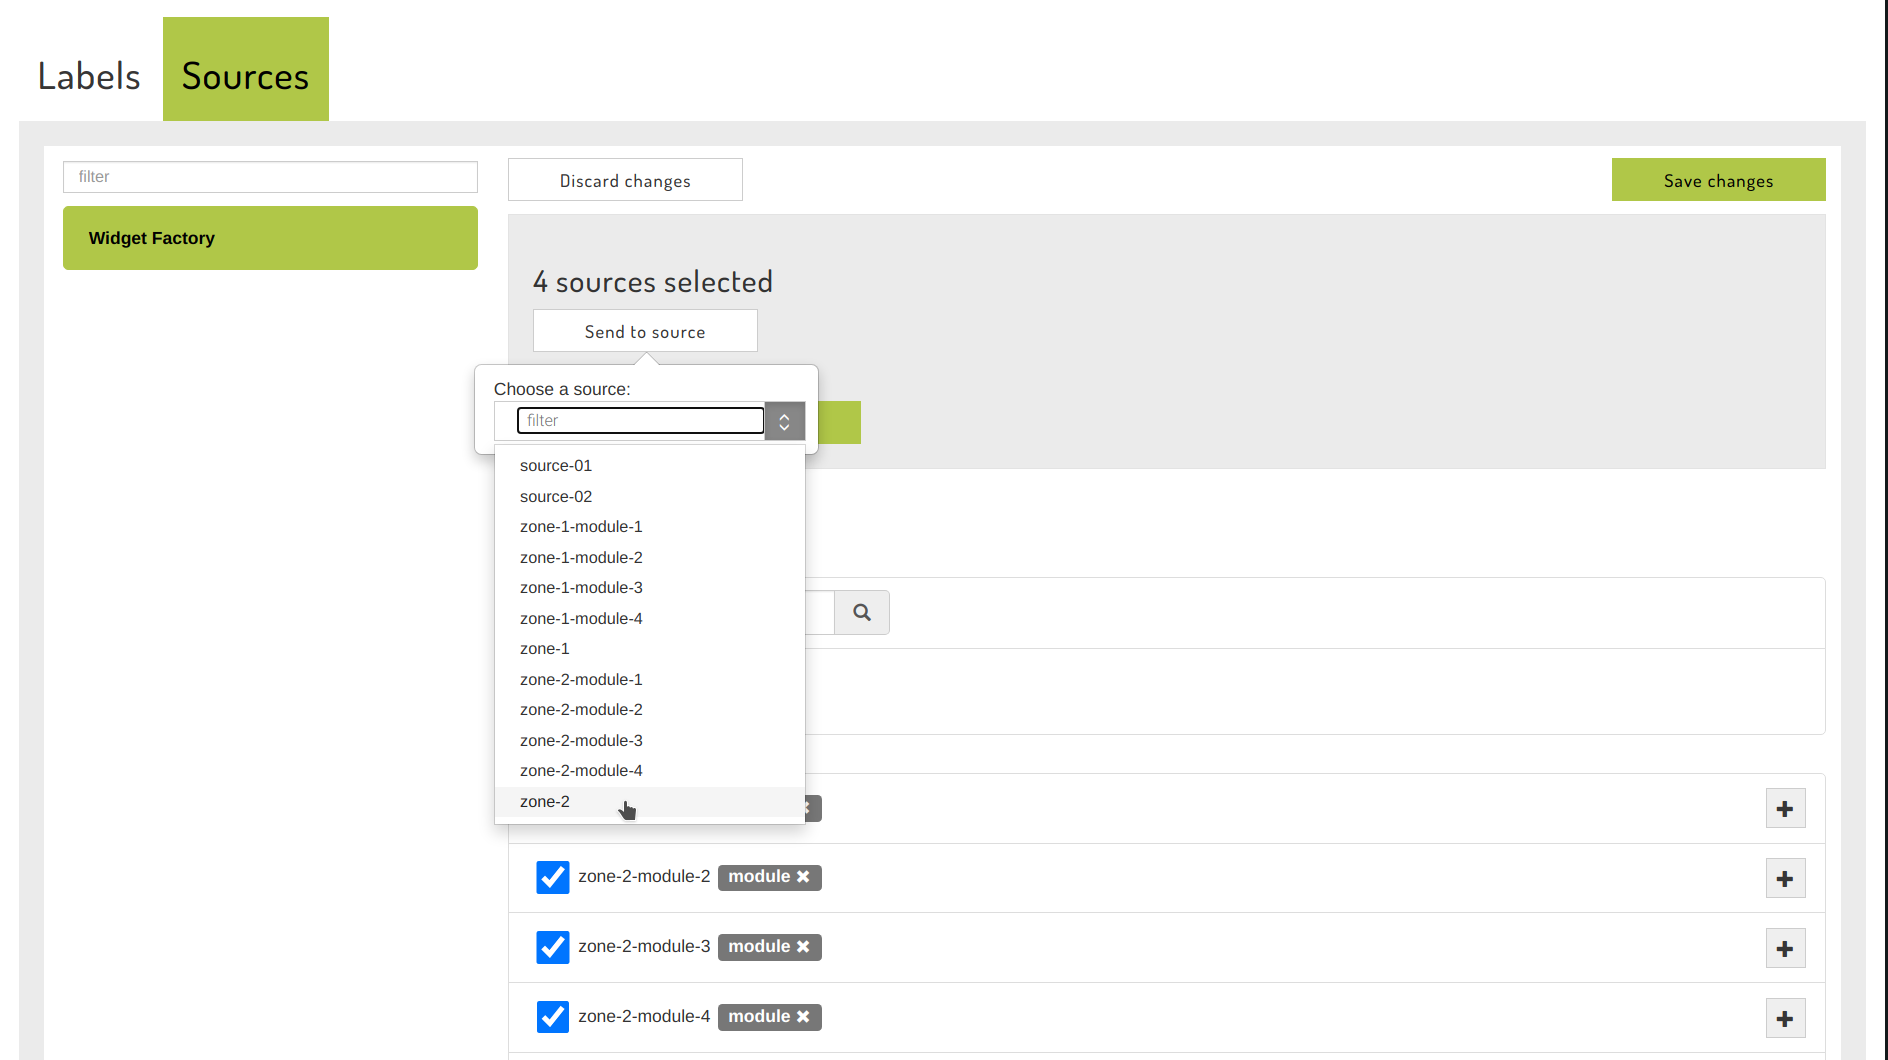
Alternatively, select multiple child sources, click the "Send to source" button and choose the parent source. Using a combination of the source filter and select all sources checkbox can aide this:
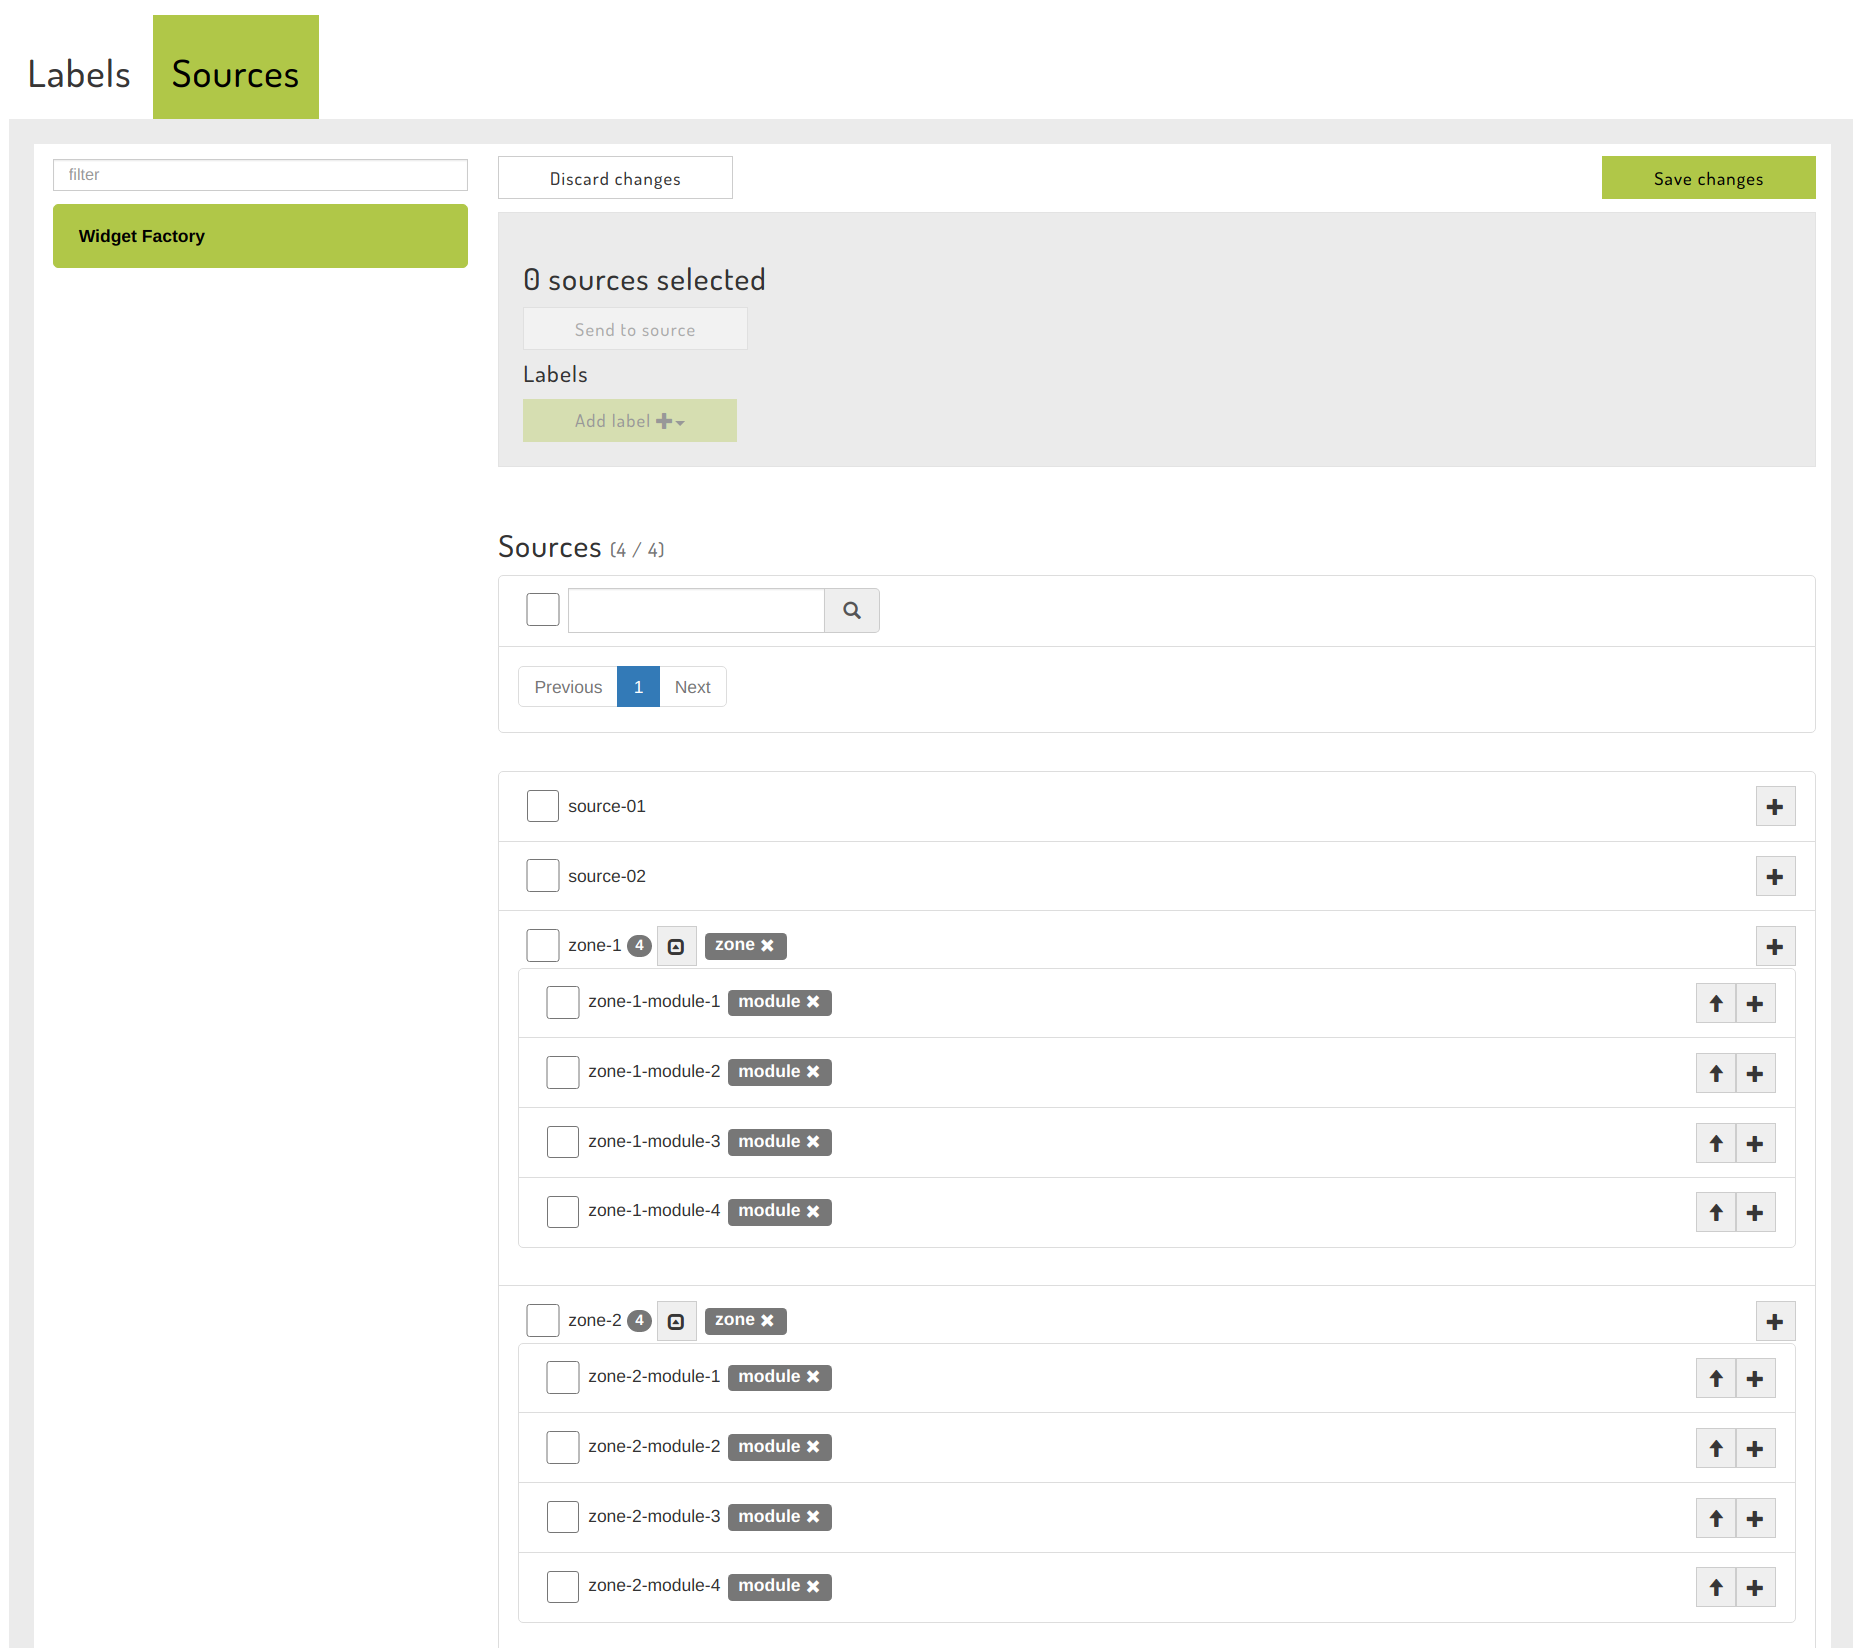
Once applied, the sources at our Widget Factory should look like:
Click "Save changes" to persist these settings.
Step 2: Dashboard settings
Once a label has been applied to at least one source, you can start to configure dashboard settings. These settings are used to generate a default set of dashboards for devices and sources associated with this label.
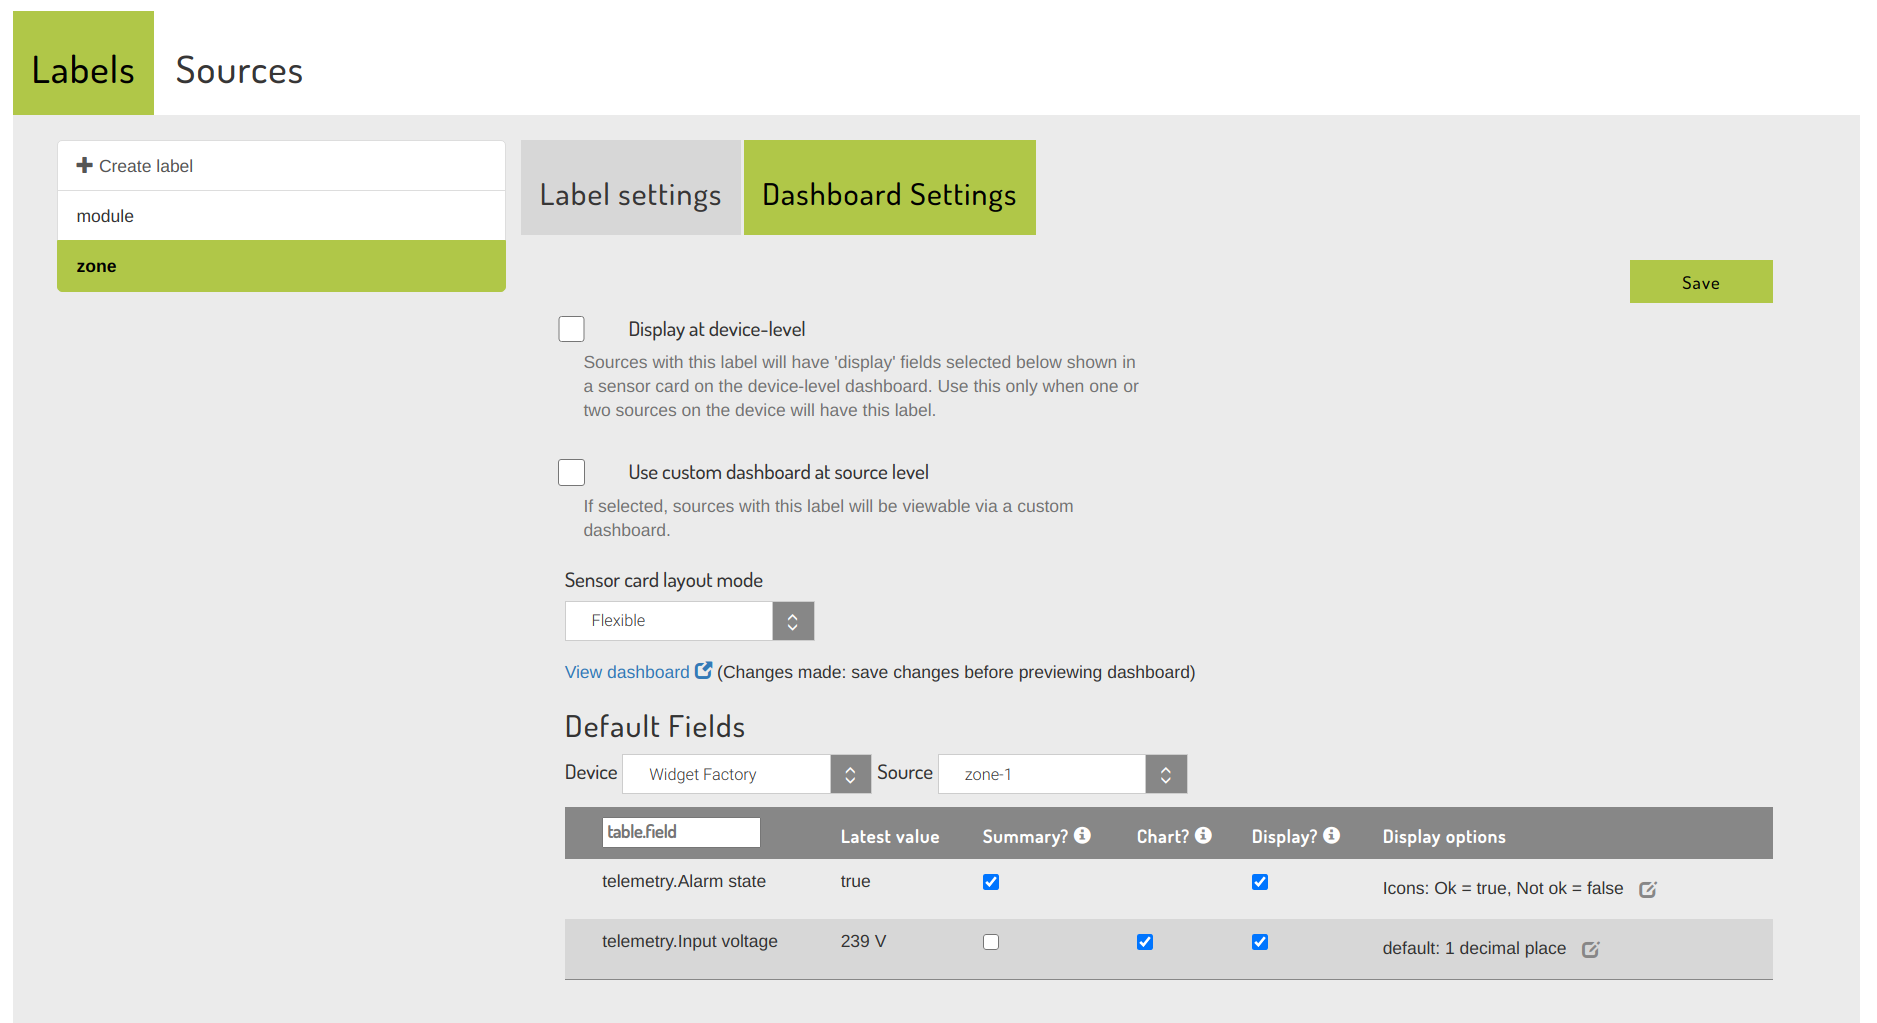
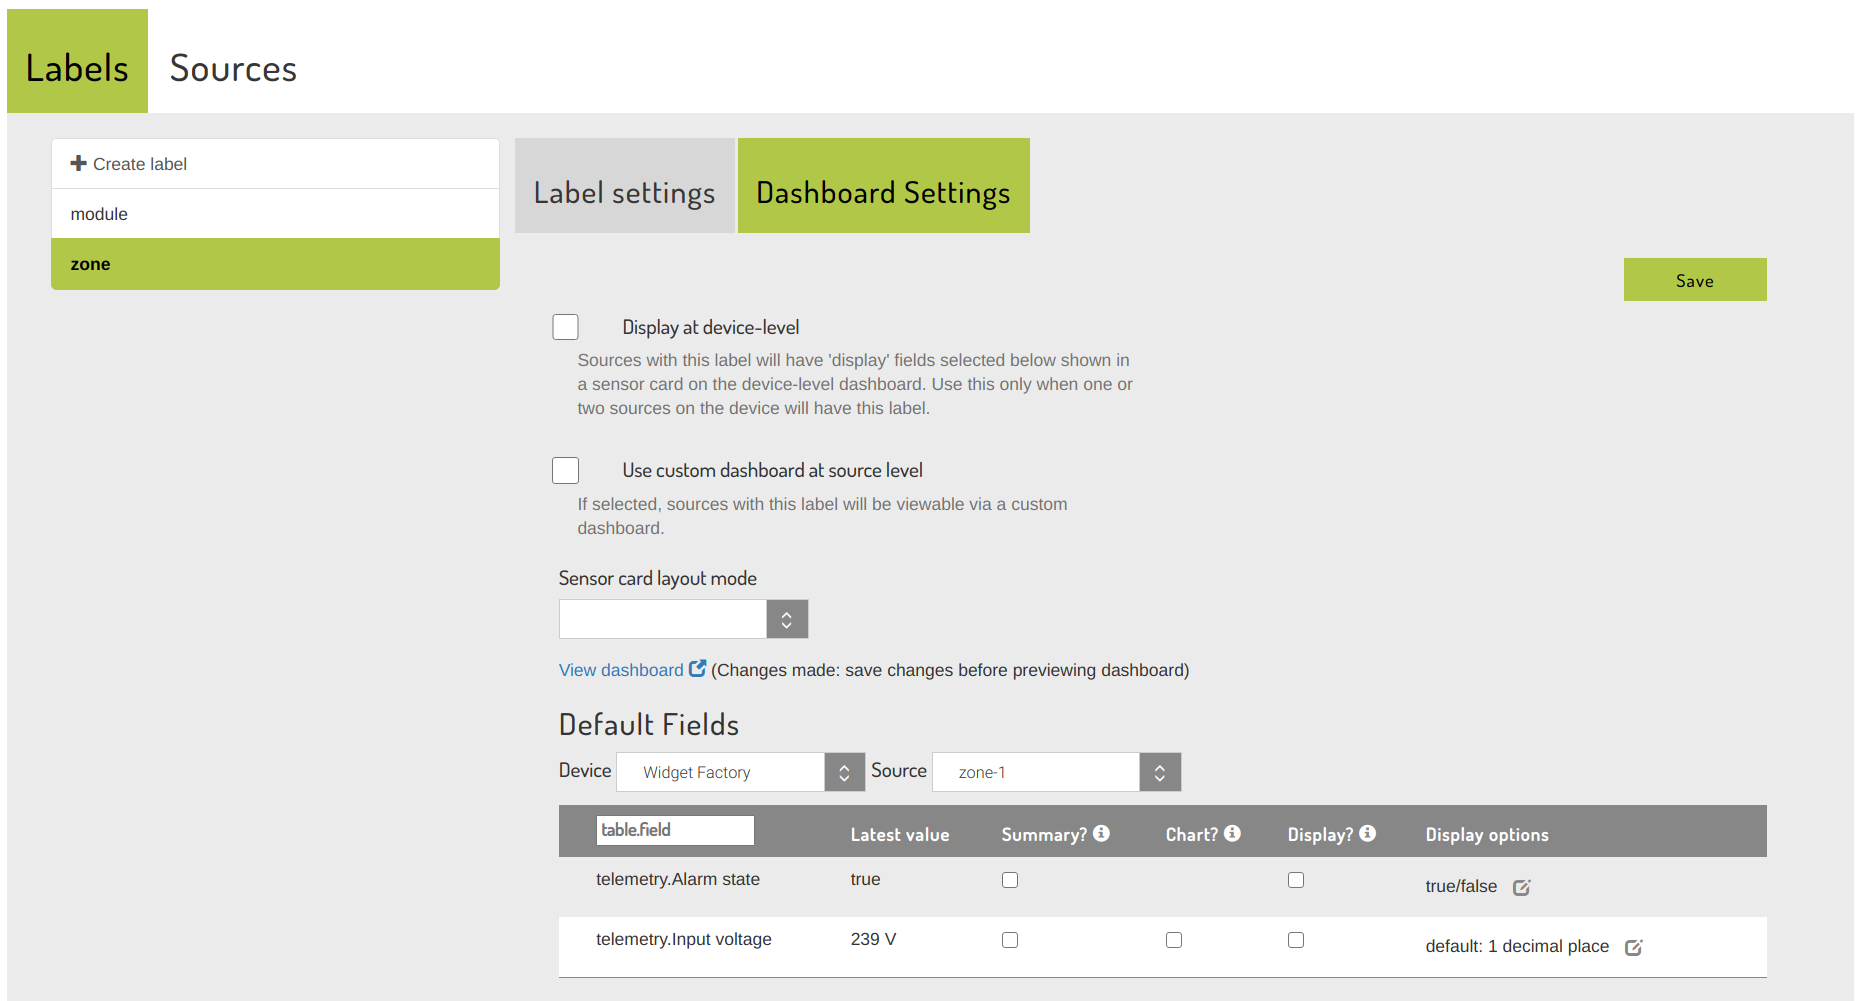
To configure these settings, return to the Labels tab on the Labelling page, choose a label, and select the Dashboard settings sub-tab:
Default Fields
This section displays all of the fields collected by sources that have the current label. The Device and Source drop-downs can be used to preview live values from any stream with the current label.
Summary: summary fields will be included in a table on the default device-level dashboard.
Chart: chart fields will be graphed in the default source-level dashboard
Display: display fields will have their latest values displayed in the default source-level dashboard, with the number of decimal places specified by the Decimal places setting in Display options
Display options: further display options are available here, dependent on the field type. Click the edit icon to update these settings
For the zone label, making the following selections will generate default device and source-level dashboards.
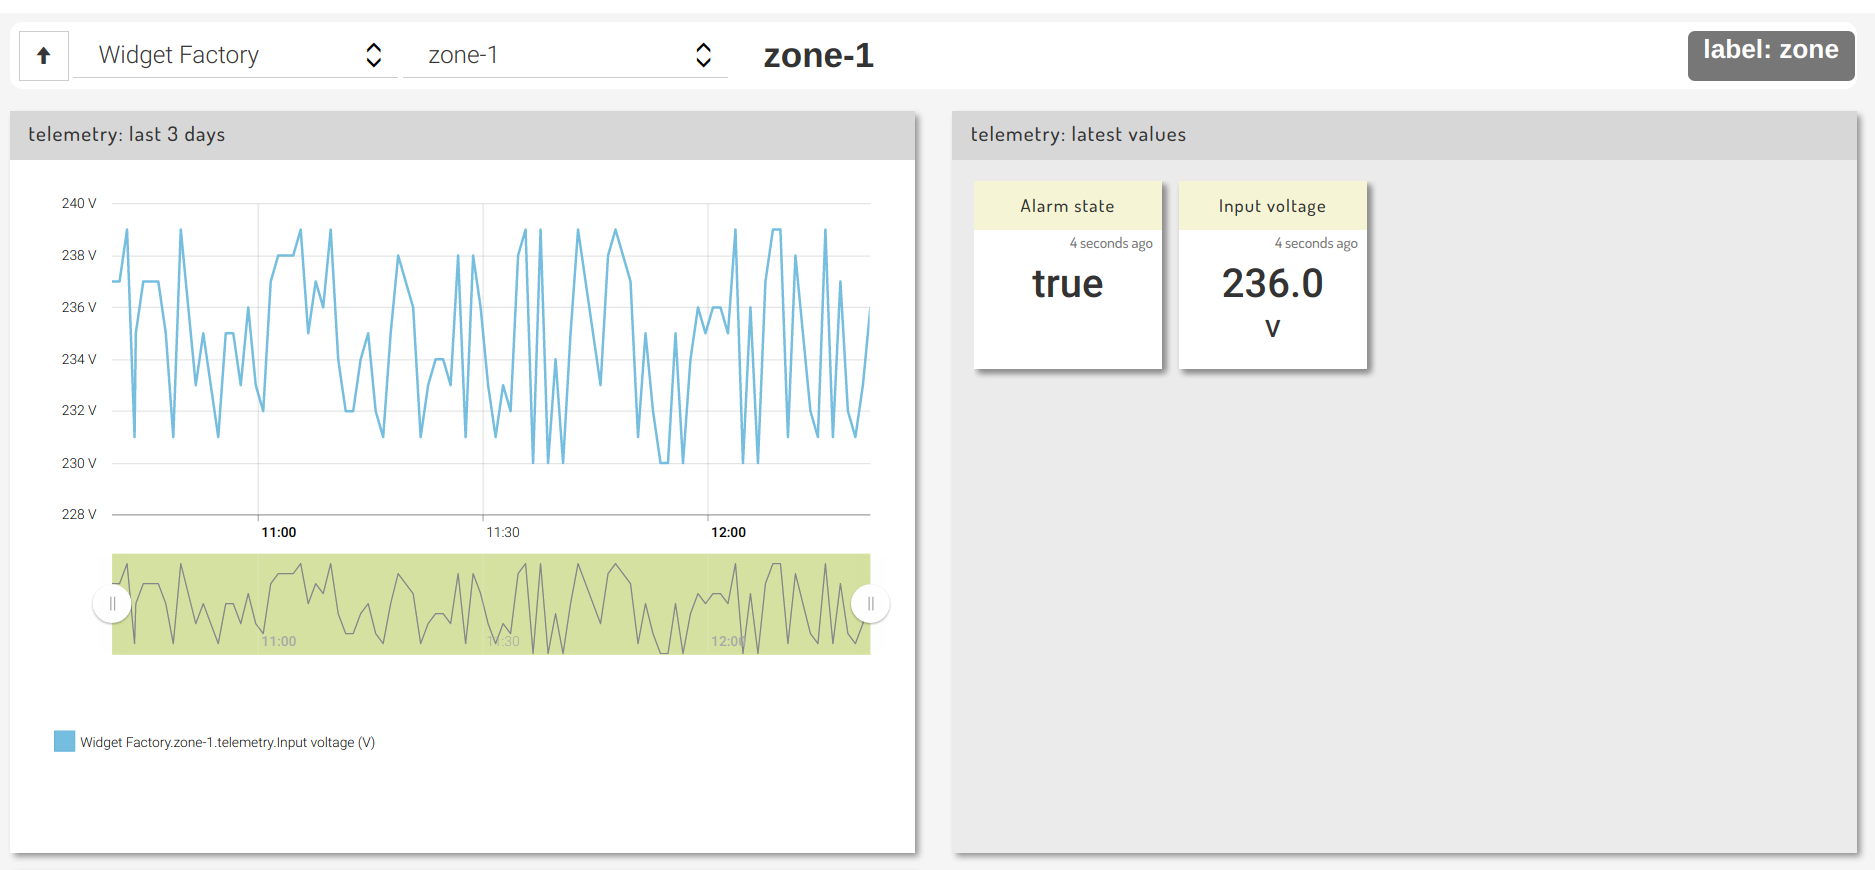
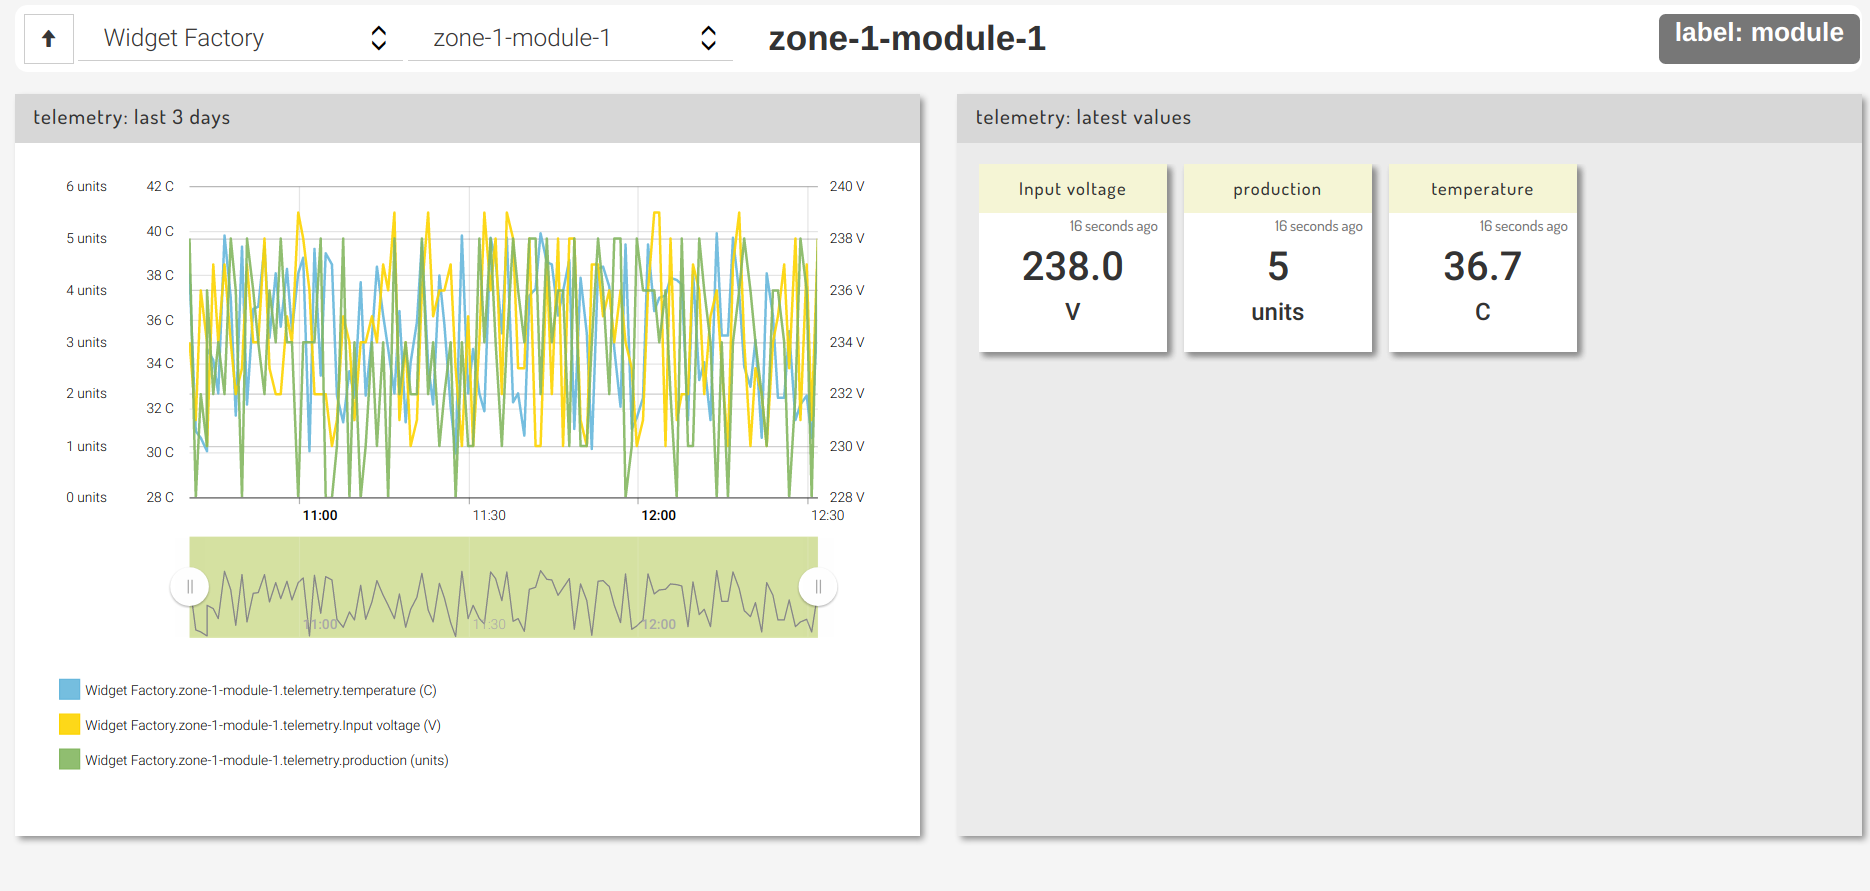
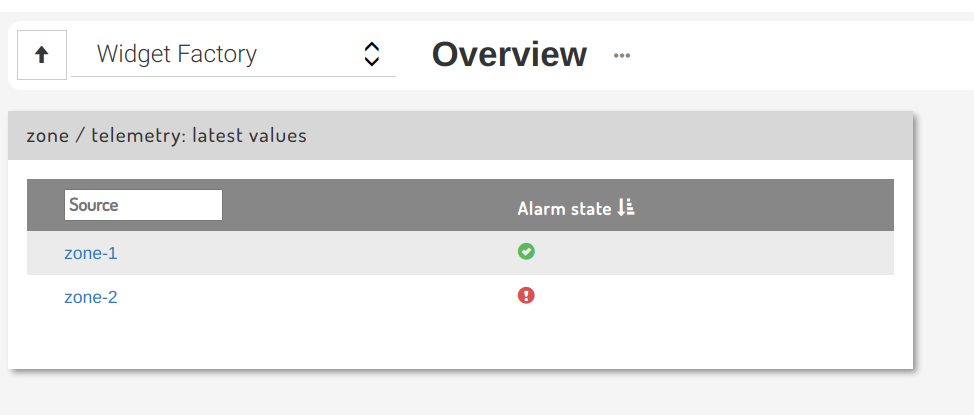
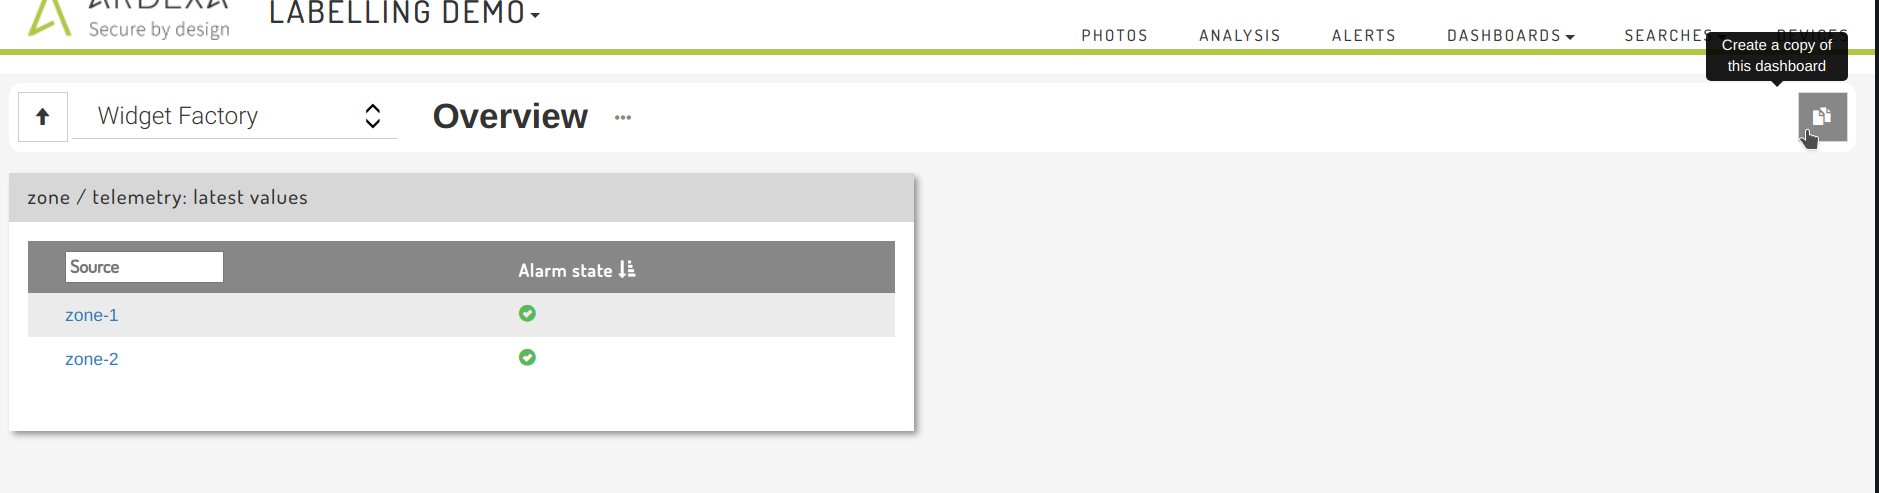
View the default dashboards by navigating to Dashboards -> Workgroup Overview and clicking a relevant device.
Click through to zone-1 or zone-2 to see a basic source-level dashboard:
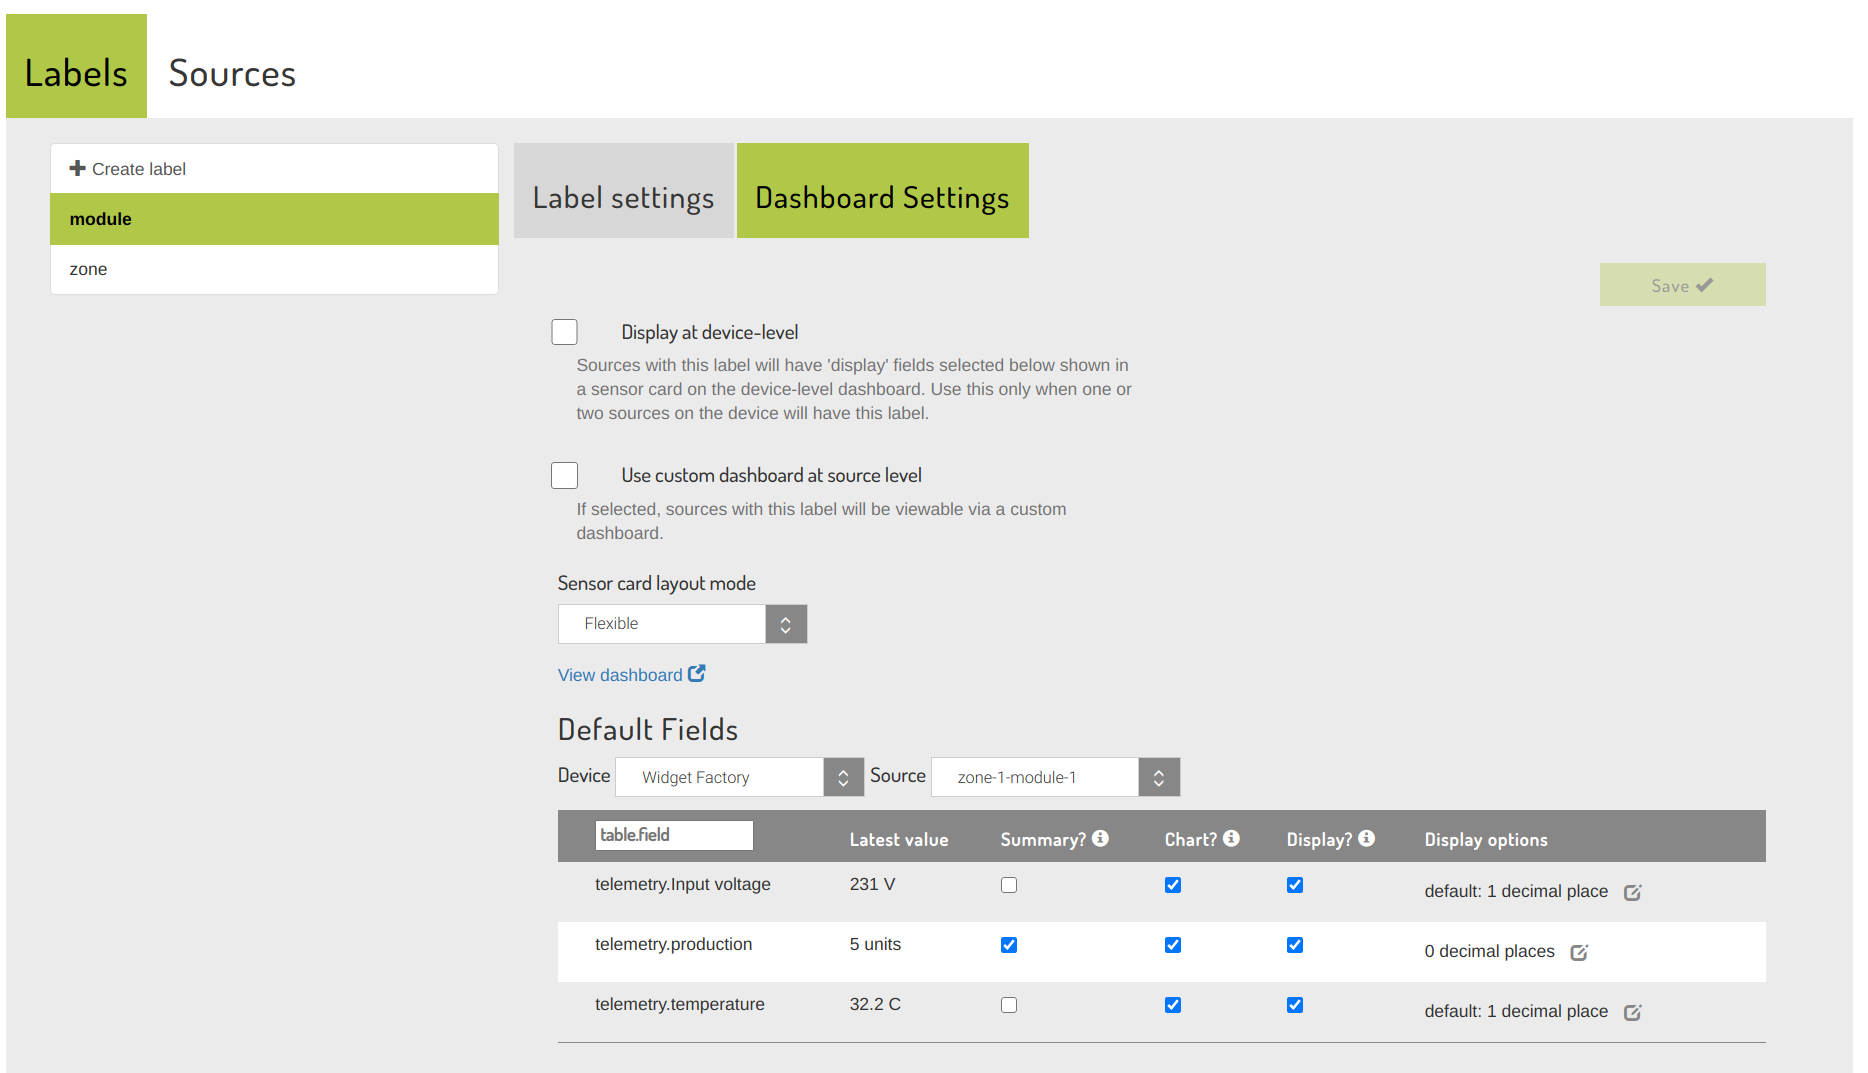
To see the nested 'module' sources (zone-1-module-1 etc) in these dashboards, configure the dashboard settings for the module label:
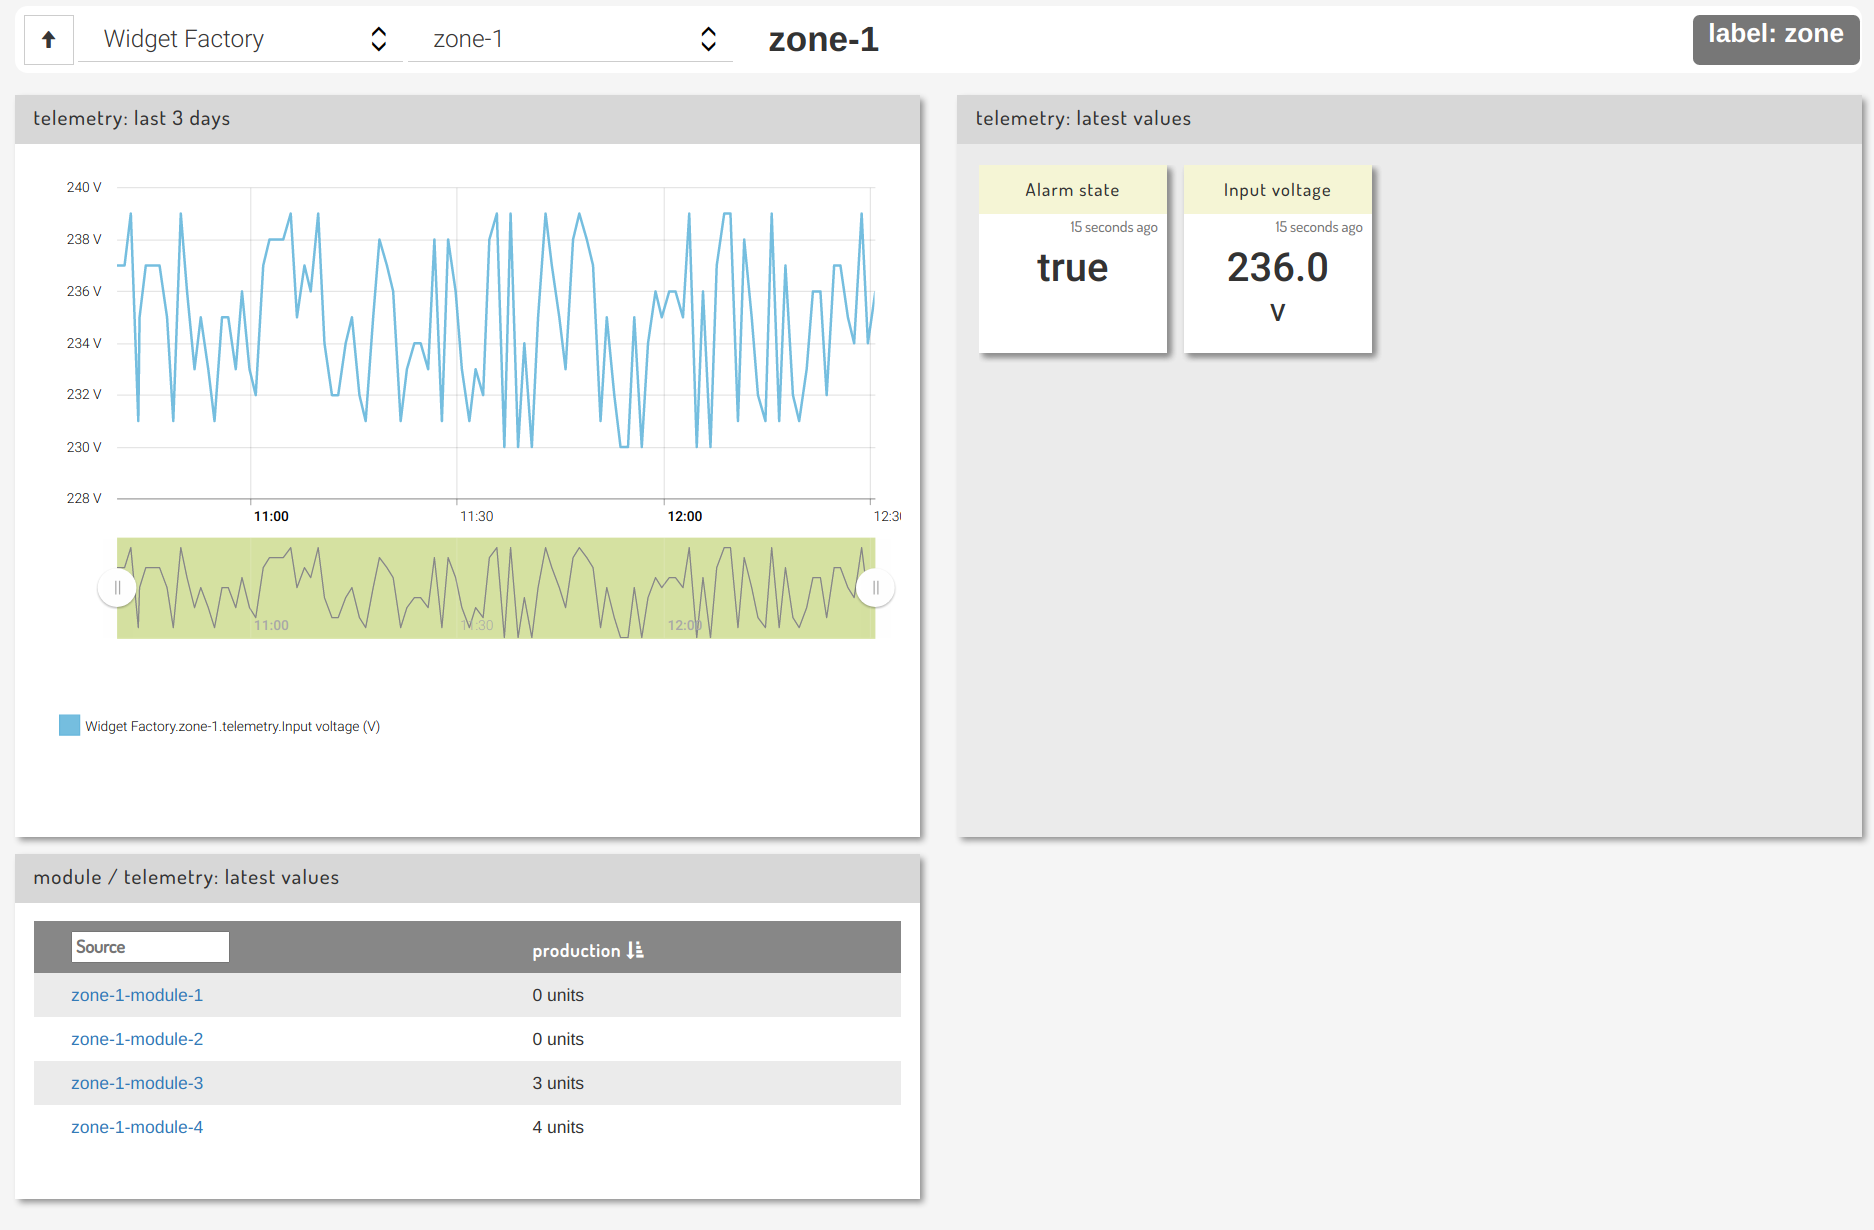
This will add the 'production' field for each module to the zone dashboard:
A new source-level dashboard will also be configured for module sources:
Note: if a source has display and/or chart fields selected, but no summary fields, an "available sources" card with a list of sources will be displayed in the device or parent source-level dashboard to enable the user to drill down to the source level.
Label options
Display at device-level
When this is selected, the latest values from every source with this label will be displayed on the default device-level dashboard. This is recommended for labels associated with one or two sources on a device at most, for example an environmental sensor or meter covering an entire site.
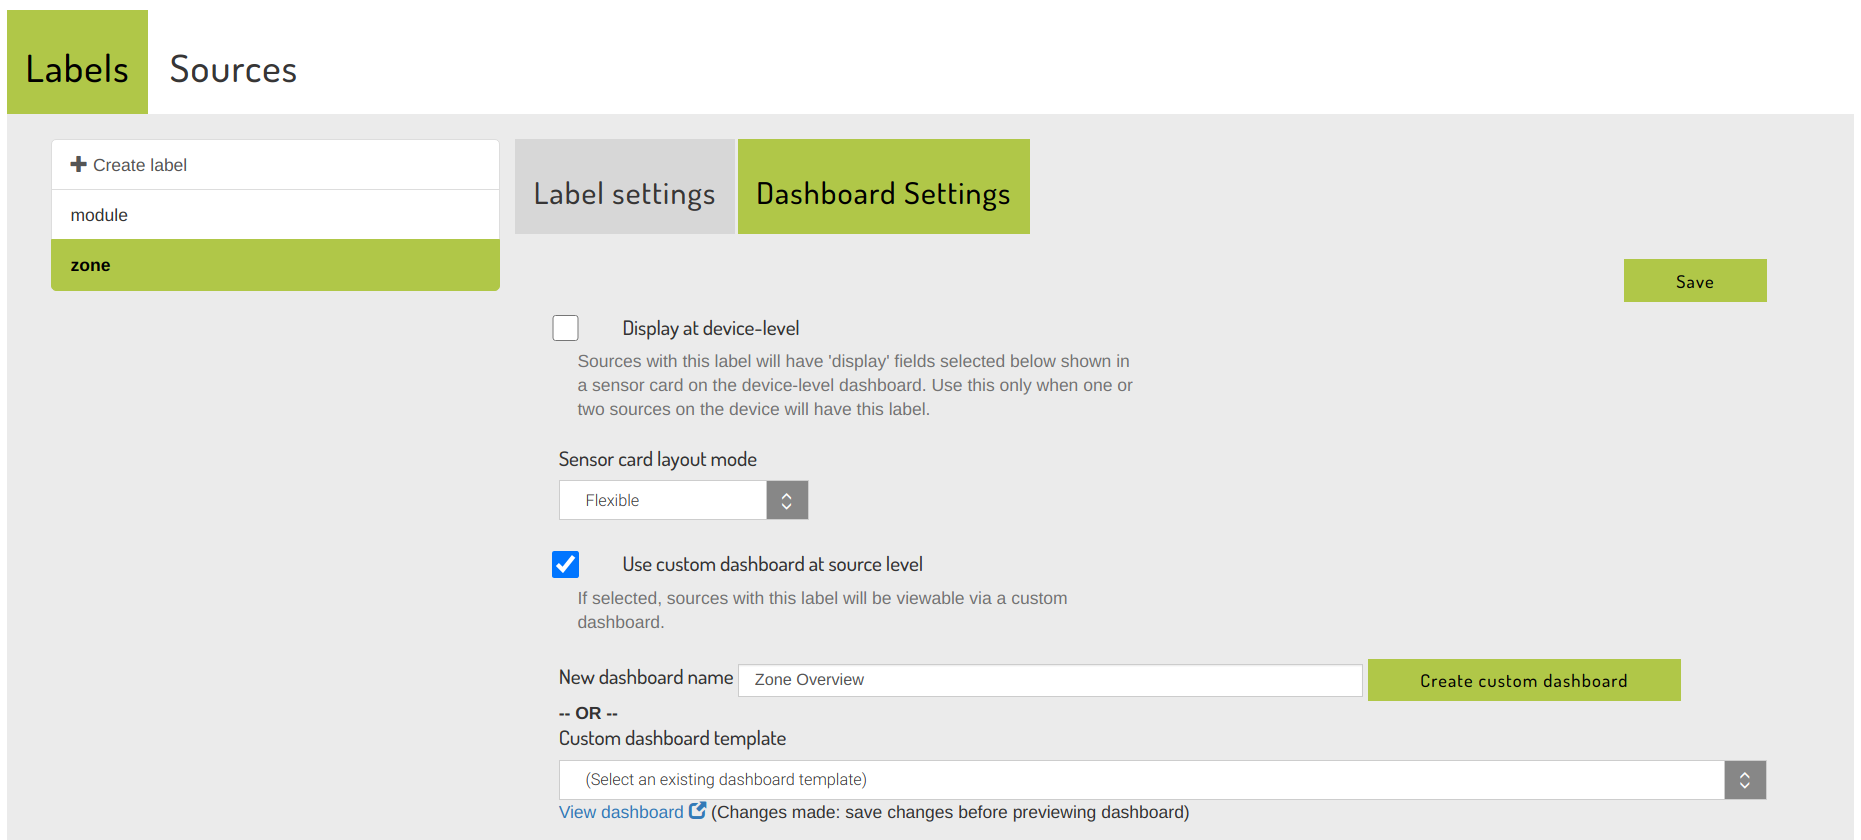
Use custom dashboard at source level
Selecting this option will allow you to create or select a source-level dashboard to act as the default for any source with this label.
A source-level dashboard can only be associated with one label. Once a dashboard has been associated with a label, it will not appear in the list of available custom dashboards for other labels.
For example, to customise the zone source-level dashboard, select "Use custom dashboard at source level", enter a name for the new dashboard, and click "Create custom dashboard". Alternatively, select a pre-existing source-level dashboard from the "Custom dashboard template" list.
If a new dashboard is created, it will be generated using the current field settings using fields and child sources from the current preview device and source. Clicking the "View dashboard" link will open the newly created dashboard in a new tab. This dashboard can be edited, as described in Dashboards.
Note: once a custom source-level dashboard has been created, the label's field settings are no longer used to determine the contents of the dashboard. Un-selecting the "Use custom dashboard at source level" setting will restore the default source-level dashboard.
Sensor card layout mode
This option determines the layout of any sensor cards generated from the label. By default a "Flexible" layout will be used, where cards will automatically expand horizontally (up to a certain size) to fit their content. Selecting "Grid" layout will display sensors in a fixed-size grid.
Step 3: Customisation
Customising device-level dashboards
To customise a device-level dashboard, take a copy of the dashboard:
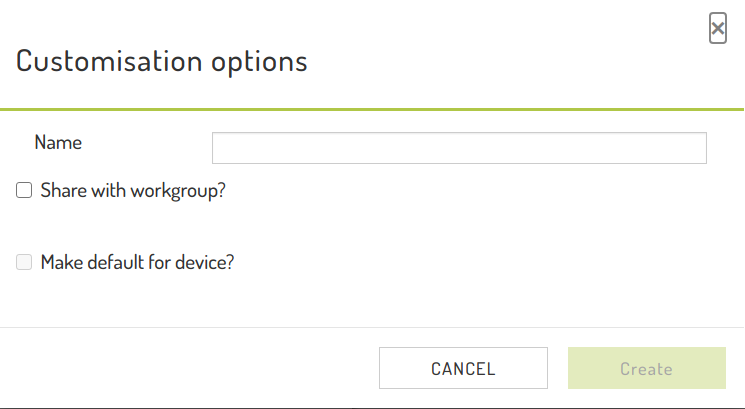
This will present you with customisation options:
Enter a name for the dashboard. Users with the Manage Searches and Dashboards permission and workgroup-level access can share the dashboard with the workgroup. If this option is selected, you can also make the customised dashboard the default for the device.
The "Make default for device" option applies to all users in the workgroup. If you select this option, make sure the dashboard
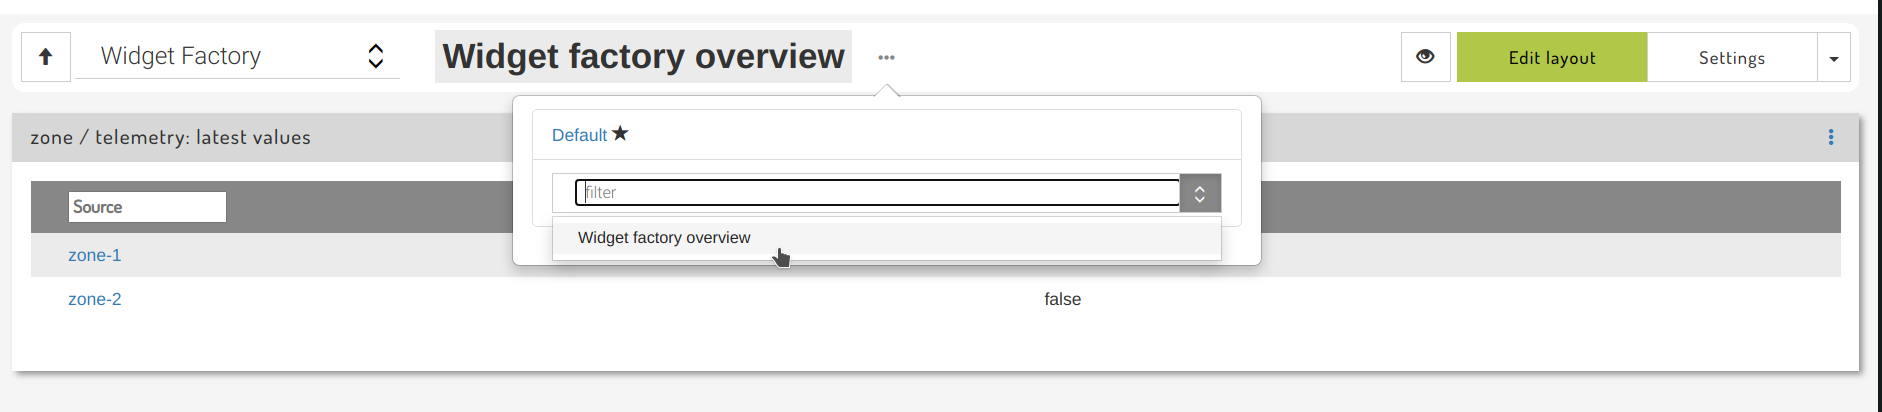
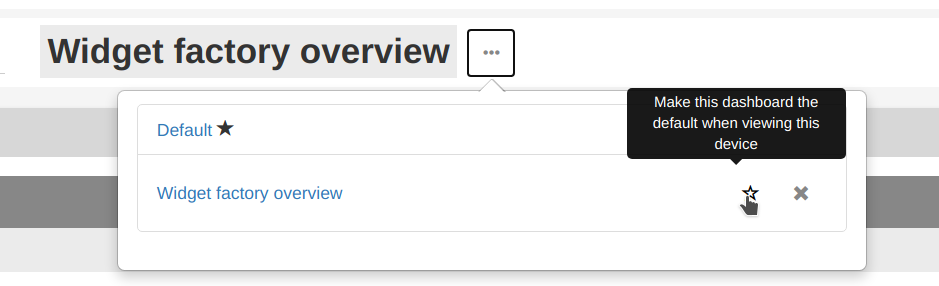
Make the necessary edits to the dashboard, then share the new dashboard with the rest of the workgroup. Once shared, it can be associated with the device:
...and, if desired, made the default dashboard for the device:
Once selected, the Widget factor overview will be displayed when the Widget Factory is selected in the Workgroup Overview.
Last updated