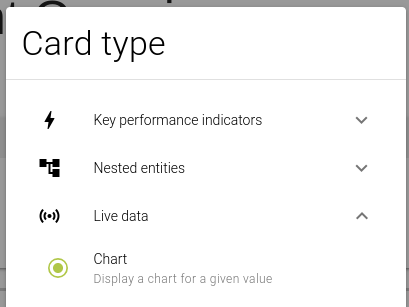
📈Chart Card
Dashboard card type which displays a chart of devices' and/or entities' table values and KPI values.
Configuration
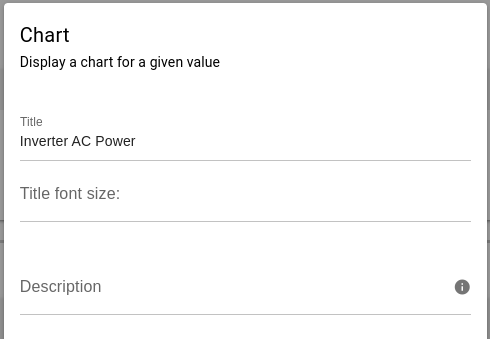
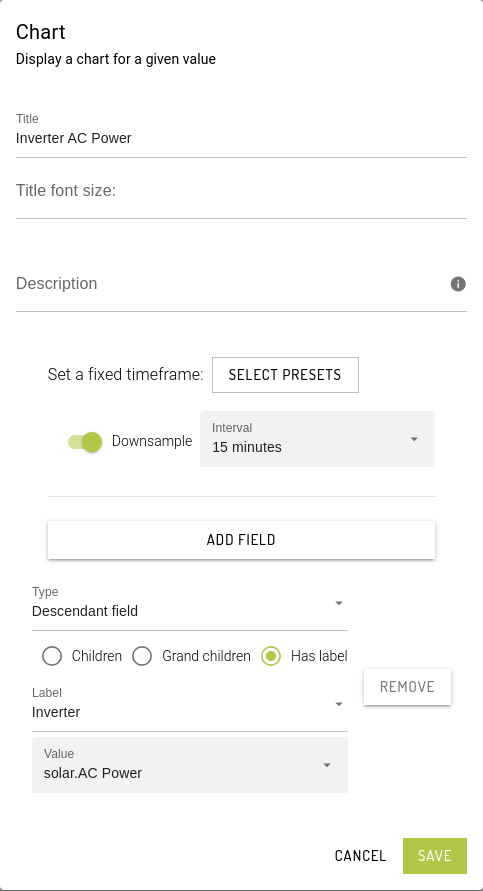
Setting the Card name (title) and description
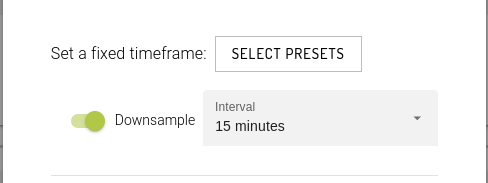
By setting a fixed timeframe from a list of presets, the chart card's timeframe will ignore the overall dashboard timeframe setting and instead will refer to the "fixed" timeframe config.
Downsampling is also turned on by default with an interval value of 15 minutes. Turning off the downsampling config will output a raw chart values of the device / entities.
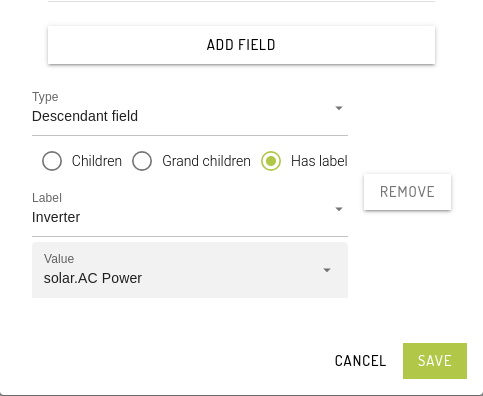
Add or remove field to display in the chart. Select from descendants options: Children entity, Grand children entity or entities with labels. Set a label to the selected field and then Save.
Chart card configuration
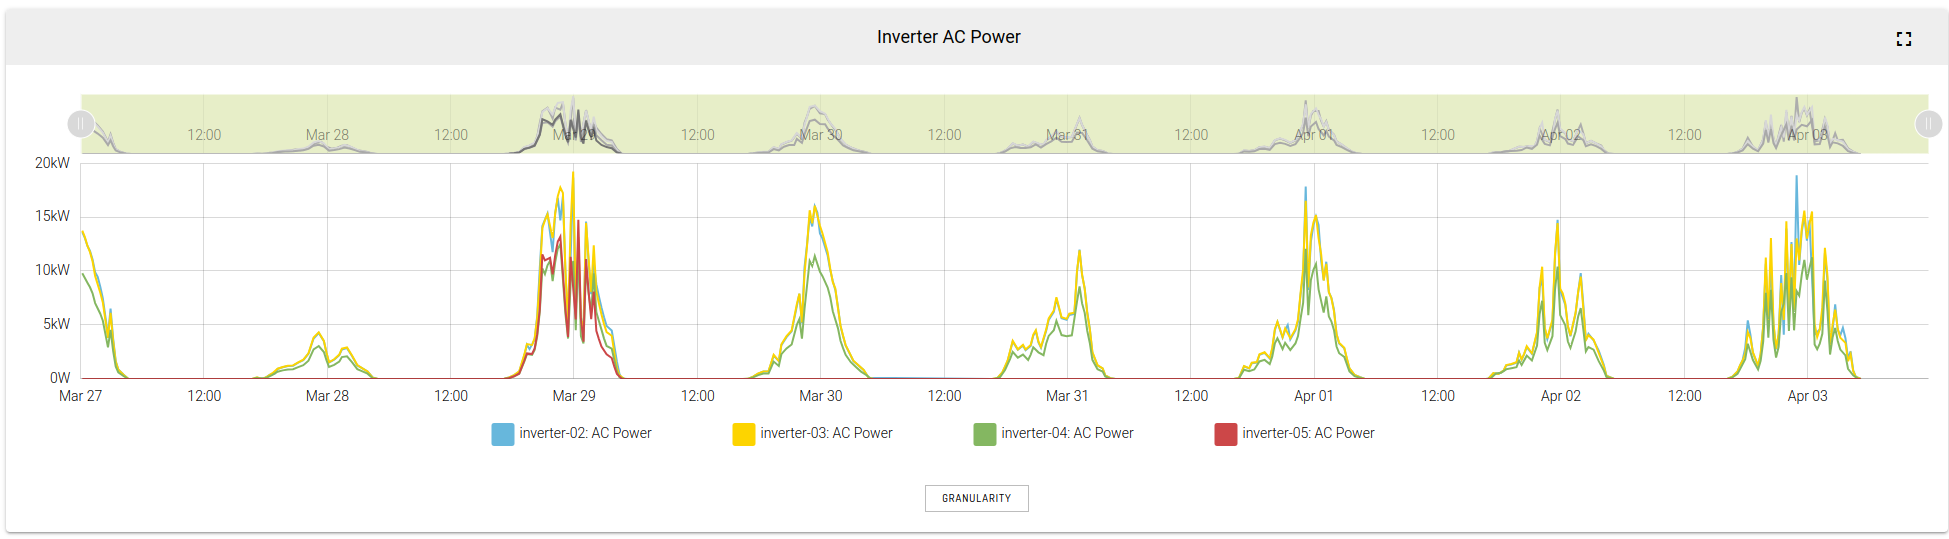
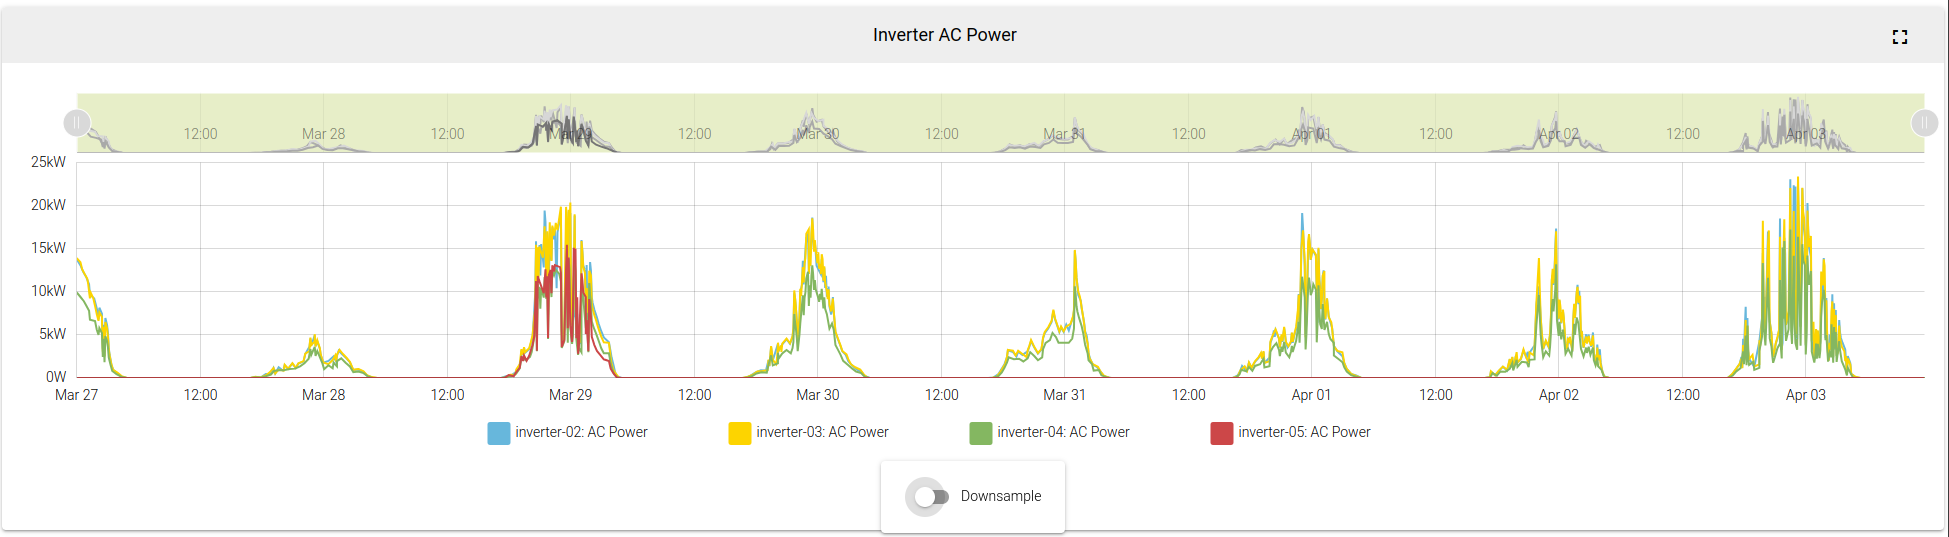
Chart card
The configuration set for the downsample and intervals settings are applied initially in the chart card.
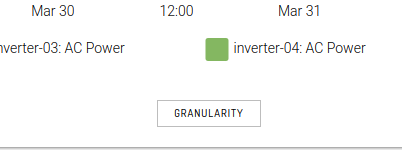
Chart Granularity
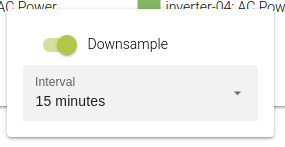
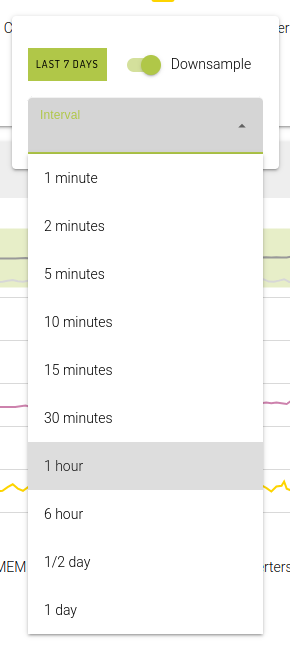
Click the Granularity button to interactively update the downsampling & interval settings.
Toggling the downsample on / off and setting the interval will override the config settings.
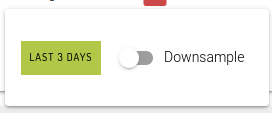
Downsample toggled OFF:
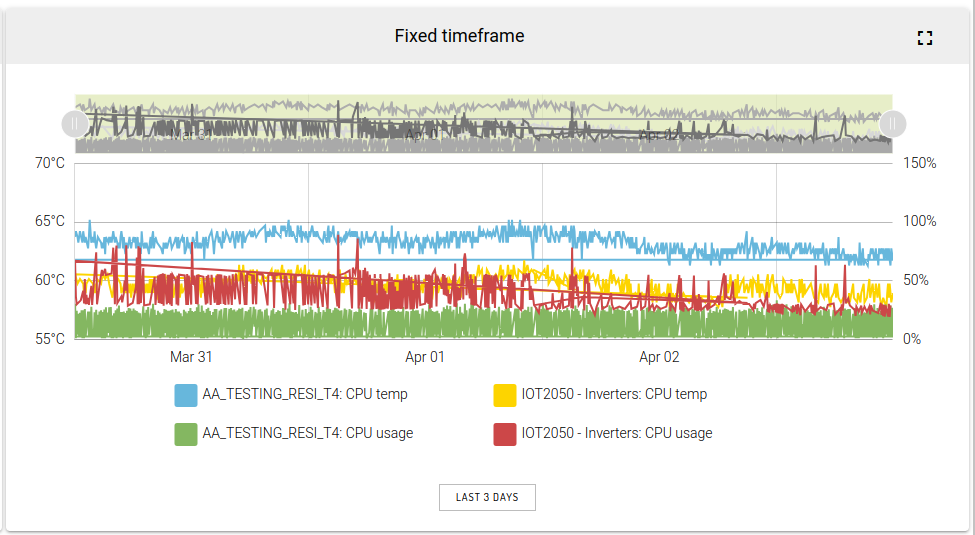
Chart Granularity: Fixed Timeframe
Chart card sample that has a preset of: "Last 3 Days" as the timeframe and downsample is toggled off.
Similar to the chart card above, interactively setting the preset and / or updating the downsample & interval will override the configured settings.
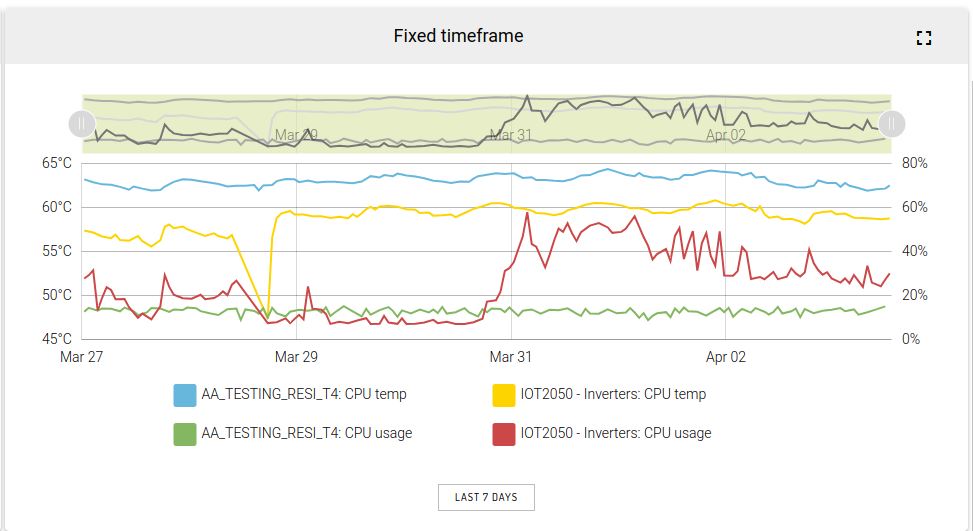
Downsample toggled ON and with preset of "Last 7 days":
Last updated